- Don Valley (UK Parliament constituency)
-
Coordinates: 53°29′31″N 1°07′59″W / 53.492°N 1.133°W
Don Valley County constituency for the House of Commons 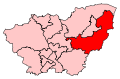
Boundary of Don Valley in South Yorkshire.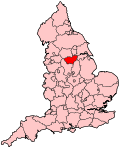
Location of South Yorkshire within England.County South Yorkshire Electorate 73,674 (December 2010)[1] Current constituency Created 1918 Member of Parliament Caroline Flint (Labour) Number of members One Created from Doncaster Overlaps European Parliament constituency Yorkshire and the Humber Don Valley is a parliamentary constituency which returns one Member of Parliament (MP) to the House of Commons of the Parliament of the United Kingdom.
Created in 1918, Don Valley is a former coal mining area which has elected only Labour MPs since 1922. The current MP is Caroline Flint, first elected in 1997.
Contents
Boundaries
The current constituency consists of the southern Borough of Doncaster, from Hatfield and the Humberhead Peatlands Nature Reserve in the north and northeast, through Branton, Auckley, and Rossington, to the Torne Valley electoral ward which consists of Wadworth, Tickhill, Braithwell, and in the west the towns of Sprotbrough, and Conisbrough.
In boundary changes which took effect at the 2010 election, Sprotbrough was moved to Doncaster North, while in the east the town of Thorne was moved from Doncaster North into Don Valley.
Members of Parliament
It is currently represented by Caroline Flint of Labour.
Election Member[2] Party 1918 James Walton National Democratic 1922 Tom Williams Labour 1959 Richard Kelley Labour 1979 Michael Welsh Labour 1983 Martin Redmond Labour 1997 Caroline Flint Labour Elections
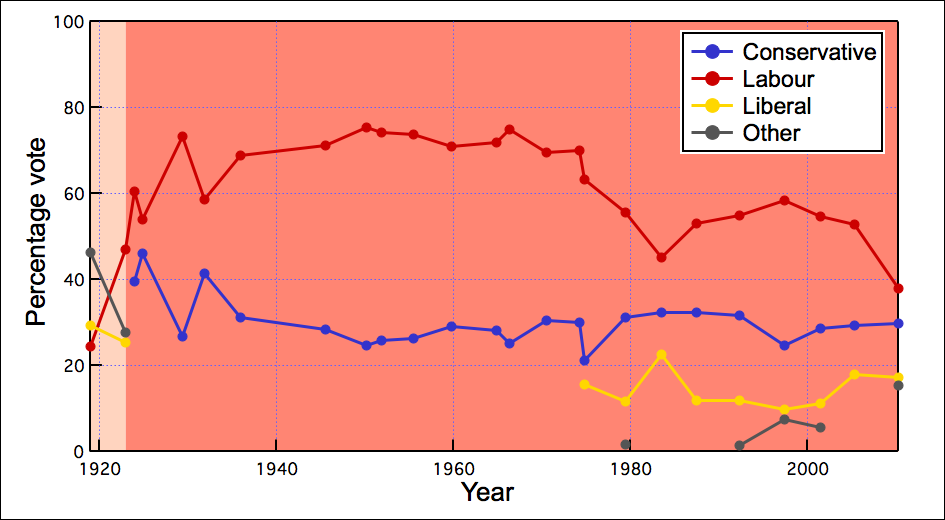
 Don Valley general election results
Elections in the 2010s
General Election 2010: Don Valley[3] Party Candidate Votes % ±% Labour Caroline Flint 16,472 37.9 -18.6 Conservative Matt Stephens 12,877 29.7 +2.7 Liberal Democrat Edwin Simpson 7,422 17.1 +0.6 BNP Erwin Toseland 2,112 4.9 N/A UKIP William Shaw 1,904 4.4 N/A English Democrats Bernie Aston 1,756 4.0 N/A Independent Martin Williams 887 2.0 N/A Majority 3,595 8.3 -15 Turnout 43,430 59.3 +6.0 Labour hold Swing Elections in the 2000s
General Election 2005: Don Valley Party Candidate Votes % ±% Labour Caroline Flint 19,418 52.7 -1.9 Conservative Adam Duguid 10,820 29.4 +0.8 Liberal Democrat Stewart Arnold 6,626 18.0 +6.8 Majority 8,598 23.3 Turnout 36,864 55 0.2 Labour hold Swing -1.3 General Election 2001: Don Valley Party Candidate Votes % ±% Labour Caroline Flint 20,009 54.6 -3.6 Conservative James Browne 10,489 28.6 +4.0 Liberal Democrat Philip Smith 4,089 11.2 +1.4 Independent Terry Wilde 800 2.2 N/A UKIP David Cooper 777 2.1 N/A Socialist Labour Nigel Ball 466 1.3 -1.1 Majority 9,520 26.0 Turnout 36,630 54.8 -11.5 Labour hold Swing Elections in the 1990s
General Election 1997: Don Valley Party Candidate Votes % ±% Labour Caroline Flint 25,376 58.3 Conservative Clare Gledhill 10,717 24.6 Liberal Democrat Paul Johnston 4,238 9.7 Referendum Party P. Davis 1,379 3.2 Socialist Labour Nigel Ball 1,024 2.4 Green S. Platt 493 1.1 ProLife Alliance C. Johnson 330 0.8 Majority 14,659 Turnout 66.4 Labour hold Swing General Election 1992: Don Valley[4] Party Candidate Votes % ±% Labour Martin Redmond 32,008 55.0 +1.9 Conservative N Paget-Brown 18,474 31.7 −0.5 Liberal Democrat M Jevons 6,920 11.9 −2.7 Green TS Platt 803 1.4 +1.4 Majority 13,534 23.3 +2.4 Turnout 58,205 76.3 +2.5 Labour hold Swing +1.2 Elections in the 1980s
General Election 1987: Don Valley Party Candidate Votes % ±% Labour Martin Redmond 29,200 53.1 Conservative C. H. Gallagher 17,733 32.3 Liberal W. K. Whitaker 8,027 11.9 Majority 11,467 20.9 Turnout 73.8 Labour hold Swing General Election 1983: Don Valley Party Candidate Votes % ±% Labour Martin Redmond 23,036 45.1 Conservative B. Utting 16,570 32.4 Liberal D. Lange 11,482 22.5 Majority 6,466 24.7 Turnout 69.9 Labour hold Swing Elections in the 1970s
General Election 1979: Don Valley Party Candidate Votes % ±% Labour Michael Welsh 39,603 55.6 Conservative Roger Freeman 22,243 31.2 Liberal E. Simpson 8,238 11.6 Workers Party I. Connelly 720 1.0 Workers Revolutionary T. McCabe 398 0.6 Majority 17,360 24.4 Turnout 74.7 Labour hold Swing General Election October 1974: Don Valley Party Candidate Votes % ±% Labour Richard Kelley 41,187 63.3 Conservative P. J. Le Bosquet 13,767 21.1 Liberal E. Simpson 10,161 15.6 Majority 27,420 42.1 Turnout 73.6 Labour hold Swing General Election February 1974: Don Valley Party Candidate Votes % ±% Labour Richard Kelley 48,737 70.1 Conservative P. J. Le Bosquet 20,792 29.9 Majority 27,945 40.2 Turnout 79.1 Labour hold Swing General Election 1970: Don Valley Party Candidate Votes % ±% Labour Richard Kelley 42,496 69.5 Conservative T. W. G. Jackson 18,673 30.5 Majority 23,823 39.0 Turnout 73.1 Labour hold Swing Elections in the 1960s
General Election 1966: Don Valley Party Candidate Votes % ±% Labour Richard Kelley 43,973 74.9 Conservative R. Storey 14,738 25.1 Majority 29,235 49.8 Turnout 78.3 Labour hold Swing General Election 1964: Don Valley Party Candidate Votes % ±% Labour Richard Kelley 42,452 71.9 Conservative D. P. Jeffcock 16,593 28.1 Majority 25,859 43.8 Turnout 80.8 Labour hold Swing Elections in the 1950s
General Election 1959: Don Valley Party Candidate Votes % ±% Labour Richard Kelley 40,935 70.9 Conservative G. H. Dodsworth 16,787 29.1 Majority 24,148 41.8 Turnout 83.8 Labour hold Swing General Election 1955: Don Valley Party Candidate Votes % ±% Labour Tom Williams 38,433 73.7 Conservative J. V. Thornton 13,701 26.3 Majority 24,732 47.4 Turnout 81.2 Labour hold Swing General Election 1951: Don Valley Party Candidate Votes % ±% Labour Tom Williams 39,687 74.1 Conservative D. S. B. Hopkins 13,862 25.9 Majority 25,825 48.2 Turnout 85.9 Labour hold Swing General Election 1950: Don Valley Party Candidate Votes % ±% Labour Tom Williams 39,789 75.4 Conservative D. Graham 12,982 24.6 Majority 26,807 49.9 Turnout 87.7 Labour hold Swing Elections in the 1940s
General Election 1945: Don Valley Party Candidate Votes % ±% Labour Tom Williams 40,153 71.7 Conservative J. J. A. N. Ross 15,832 28.3 Majority 24,321 43.4 Turnout 73.2 Labour hold Swing Elections in the 1930s
General Election 1935: Don Valley Party Candidate Votes % ±% Labour Tom Williams 33,220 68.9 Conservative John Arbuthnot 14,961 31.1 Majority 18,259 37.8 Turnout 70.0 Labour hold Swing General Election 1931: Don Valley Party Candidate Votes % ±% Labour Tom Williams 27,599 58.6 Conservative S. Hardwick 19,506 41.4 Majority 8,093 17.2 Turnout 71.2 Labour hold Swing Elections in the 1920s
General Election 1929: Don Valley Party Candidate Votes % ±% Labour Tom Williams 31,466 73.3 Conservative Walter Sydney Liddall 11,467 26.7 Majority 19,999 46.6 Turnout 69.7 Labour hold Swing General Election 1924: Don Valley Party Candidate Votes % ±% Labour Tom Williams 14,958 53.9 Conservative J. W. Reynolds 12,463 46.1 Majority 2,135 7.8 Turnout 72.8 Labour hold Swing General Election 1923: Don Valley Party Candidate Votes % ±% Labour Tom Williams 12,898 60.4 Conservative J. W. Reynolds 8,451 39.6 Majority 4,447 20.8 Turnout 62.2 Labour hold Swing General Election 1922: Don Valley Party Candidate Votes % ±% Labour Tom Williams 9,903 47.0 National Liberal James Walton 5,793 27.6 Liberal J. H. Freeborough 5,332 25.4 Majority 4,106 19.4 Turnout 65.4 Labour gain from National Democratic Swing Elections in the 1910s
General Election 1918: Don Valley Party Candidate Votes % ±% Coalition National Democratic James Walton 6,095 46.2 Liberal Hastings Lees-Smith 3,868 29.3 Labour E. Hough 3,226 24.5 Majority 2,227 16.9 Turnout 45.9 Coalition National Democratic hold Swing See also
Notes and references
- ^ "Electorate Figures - Boundary Commission for England". 2011 Electorate Figures. Boundary Commission for England. 4 March 2011. http://www.boundarycommissionforengland.org.uk/electoral-figures/electoral-figures.htm. Retrieved 13 March 2011.
- ^ Leigh Rayment's Historical List of MPs – Constituencies beginning with "D" (part 2)
- ^ "Don Valley". BBC News, election 2010. BBC. 2010-05-06. http://news.bbc.co.uk/2/shared/election2010/results/constituency/b39.stm. Retrieved 8 May 2010.
- ^ "Politics Resources". Election 1992. Politics Resources. 9 April 1992. http://www.politicsresources.net/area/uk/ge92/ge92index.htm. Retrieved 2010-12-06.
Sources
- Guardian Unlimited Politics (Election results from 1992 to the present)
- http://www.psr.keele.ac.uk/ (Election results from 1951 to the present)
- F. W. S. Craig, British Parliamentary Election Results 1918 - 1949
- F. W. S. Craig, British Parliamentary Election Results 1950 - 1970
Categories:- Politics of Doncaster
- Parliamentary constituencies in Yorkshire and the Humber
- United Kingdom Parliamentary constituencies established in 1918


Wikimedia Foundation. 2010.