- Monmouth (UK Parliament constituency)
-
Not to be confused with Monmouth (Assembly constituency).For other constituencies which may be confused with this constituency, see Monmouth constituency (disambiguation).
Coordinates: 51°46′05″N 2°48′40″W / 51.768°N 2.811°W
Monmouth County constituency for the House of Commons 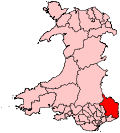
Boundary of Monmouth in Wales.Preserved county Gwent Electorate 65,432 (December 2010)[1] Major settlements Abergavenny, Chepstow, Monmouth Current constituency Created 1918 Member of Parliament David Davies (Conservative) Number of members One Created from Monmouth Boroughs, North Monmouthshire and South Monmouthshire Overlaps Welsh Assembly South East Wales European Parliament constituency Wales Monmouth (Welsh: Sir Fynwy) is a county constituency of the House of Commons of the Parliament of the United Kingdom (at Westminster). It elects one Member of Parliament (MP) by the first past the post of election. The constituency was created for the 1918 general election.
The Monmouth Welsh Assembly constituency, created in 1999, has normally the same boundaries as the Westminster constituency.
Contents
History
The constituency has traditionally favoured the Conservative Party (as one might expect from a predominately rural area) but has been captured by Labour at times of strength, such as 1997.
The current MP is the Conservative David Davies, elected in 2005 and a former member for the Welsh Assembly seat of the same name. To avoid confusion with the Yorkshire Conservative David Davis, he is named in Hansard as "David T.C. Davies".
Boundaries

1983 onwards
The constituency is one of eight covering the preserved county of Gwent. The other seven are Blaenau Gwent, Caerphilly, Islwyn, Merthyr Tydfil and Rhymney, Newport East, Newport West and Torfaen. Merthyr Tydfil and Rhymney, however, straddles the boundary with the preserved county of Mid Glamorgan. It covers most of current local authority of Monmouthshire, with the main towns being Chepstow and Monmouth.
For the 2010 United Kingdom general election, there were no changes to the boundaries of the Monmouth constituency stemming from the Fifth Review of the Boundary Commission for Wales.[2] Likewise there were no boundary changes in 1997
1918 to 1983
As first used in the 1918 general election, the constituency was a creation of the Representation of the People Act 1918 as one of six constituencies covering the county of Monmouth. Prior to the 1918 election the county had been covered, nominally, by the county constituencies of Northern Monmouthshire, Southern Monmouthshire, and Western Monmouthshire, and the Monmouth Boroughs borough constituency. By 1918, however, administrative county boundaries were out of alignment with constituency boundaries. The new constituency boundaries took account of the new local government boundaries.
The other Monmouthshire constituencies defined by 1918 legislation were the county constituencies of Abertillery, Bedwellty, Ebbw Vale and Pontypool, and the borough constituency of Newport. This general pattern was maintained until 1983, nine years after the administrative county they were based on had been abolished, but there were some boundary changes during the 1918 to 1983 period.
 County of Monmouth
In 1918 the Monmouth constituency was defined as consisting of the municipal boroughs of Abergavenny, and Monmouth, the urban districts of Caerleon, Chepstow, and Usk, the rural districts of Abergavenny, Chepstow, Magor, Monmouth, and Pontypool, and part of the rural district of St Mellons,[3] and the same boundaries were used for the general elections of 1922, 1923, 1924, 1929, 1931, 1935 and 1945.
New boundaries, created by the House of Commons (Redistribution of Seats) Act 1949, were used for the 1950 general election, and the Monmouth constituency was defined as consisting of the municipal boroughs of Abergavenny, and Monmouth, the urban districts of Caerleon, Chepstow, and Usk, and rural districts of Abergavenny, Chepstow, Magor and St Mellons, Monmouth, and Pontypool.[3]
For the 1951 general election, there was some alteration to the boundaries of rural district of Magor and St Mellons.[3]
The constituency was redefined again for the 1955 general election, taking account of new local government boundaries. The result was the same list of boroughs and districts as for the 1951 election.[3] 1951 boundaries were used also in the general elections of 1959, 1964, 1966, 1970, February 1974, October 1974 and 1979.
In 1974, under the Local Government Act 1972, the local government county of Monmouth was abolished. For the 1983 general election, new constituency boundaries were drawn, taking account of new local government boundaries.
Members of Parliament
The following list does not include MPs who actually represented Monmouth Boroughs:
Election Member[4] Party 1918 Leolin Forestier-Walker Conservative 1934 by-election John Herbert Conservative 1939 by-election Leslie Pym Conservative 1945 by-election Peter Thorneycroft Conservative 1966 Donald Anderson Labour 1970 Sir John Stradling Thomas Conservative 1991 by-election Huw Edwards Labour 1992 Roger Evans Conservative 1997 Huw Edwards Labour 2005 David Davies Conservative Elections
Elections in the 2010s
General Election 2010: Monmouth [5] Party Candidate Votes % ±% Conservative David Thomas Charles Davies 22,466 48.3 +1.4 Labour Hamish Sandison 12,041 25.9 −11.1 Liberal Democrat Martin Blakebrough 9,026 19.4 +6.6 Plaid Cymru Jonathan Clark 1,273 2.7 +0.6 UKIP Derek Rowe 1,126 2.4 +1.2 Green Steve Millson 587 1.3 +1.3 Majority 10,425 22.4 Turnout 46,519 74.1 +0.8 Conservative hold Swing 6.2 Elections in the 2000s
General Election 2005: Monmouth Party Candidate Votes % ±% Conservative David Thomas Charles Davies 21,396 46.9 +5.0 Labour Huw Edwards 16,869 37.0 −5.8 Liberal Democrat Phylip A. D. Hobson 5,852 12.8 +1.4 Plaid Cymru Jonathan Clark 993 2.2 −0.2 UKIP John Bufton 543 1.2 −0.3 Majority 4,527 9.9 +9.0 Turnout 45,653 72.4 +0.9 Conservative gain from Labour Swing +5.4 General Election 2001: Monmouth Party Candidate Votes % ±% Labour Huw Edwards 19,021 42.8 −5.0 Conservative Roger Evans 18,637 41.9 +2.7 Liberal Democrat Neil Parker 5,080 11.4 +1.9 Plaid Cymru Marc Hubbard 1,068 2.4 +1.3 UKIP David Rowlands 656 1.5 N/A Majority 384 0.9 −7.6 Turnout 44,462 71.5 −9.1 Labour hold Swing −3.8 Elections in the 1990s
General Election 1997: Monmouth Party Candidate Votes % ±% Labour Huw Edwards 23,404 47.7 +6.8 Conservative Roger Evans 19,226 39.2 -8.0 Liberal Democrat Mark F. Williams 4,689 9.6 -1.4 Referendum Party T. Niall Warry 1,190 2.4 N/A Plaid Cymru Alan F.C. Cotton 516 1.1 +0.3 Majority 4,178 8.5 +2.2 Turnout 49,025 80.5 −5.6 Labour gain from Conservative Swing +7.4 General Election 1992: Monmouth[6] Party Candidate Votes % ±% Conservative Roger Evans 24,059 47.3 −0.3 Labour Huw Edwards 20,855 41.0 +13.3 Liberal Democrat Mrs Frances A. David 5,562 10.9 −13.1 Plaid Cymru (Green) Mel J. Witherden 431 0.8 +0.8 Majority 3,204 6.3 −13.6 Turnout 50,907 86.1 +5.3 Conservative hold Swing −6.8 Monmouth by-election, 1991 Party Candidate Votes % ±% Labour Huw Edwards 17,733 39.3 +11.6 Conservative Roger Evans 15,327 34.0 −13.5 Liberal Democrat Mrs Frances A. David 11,164 24.8 +0.8 Monster Raving Loony Screaming Lord Sutch 314 0.7 N/A Plaid Cymru (Green) Melvin Witherden 277 0.6 N/A Unitax independent Peter Carpenter 164 0.4 N/A Corrective Party Lindi St Clair 121 0.3 N/A Majority 2,406 5.3 Turnout 45,100 Labour gain from Conservative Swing 12.6 Elections in the 1980s
General Election 1987: Monmouth Party Candidate Votes % ±% Conservative Sir John Stradling Thomas 22,387 47.5 +1.6 Labour K. Gass 13,037 27.7 +6.0 Social Democrat C. D. Lindley 11,313 24.0 −4.0 Plaid Cymru S. Meredudd 363 0.77 −0.3 Majority 9,530 19.9 −1.2 Turnout 47,100 80.6 +1.73 Conservative hold Swing −2.2 General Election 1983: Monmouth Party Candidate Votes % ±% Conservative John Stradling Thomas 21,746 49.2 Social Democrat C. D. Lindley 12,403 28.0 Labour C. Short 9,593 21.7 Plaid Cymru G.O. Williams 493 1.1 Majority Turnout 78.8 Conservative hold Swing Elections in the 1970s
General Election 1979: Monmouth Party Candidate Votes % ±% Conservative John Stradling Thomas 33,547 50.47 Labour T.M. Steel 23,785 35.78 Liberal D.H. Hando 8,494 12.78 Plaid Cymru G. Williams 641 0.96 Majority 9,762 14.69 Turnout 83.00 Conservative hold Swing General Election October 1974: Monmouth Party Candidate Votes % ±% Conservative John Stradling Thomas 25,460 42.79 Labour R.O. Faulkner 23,118 36.86 Liberal D.H. Hando 10,076 16.94 Plaid Cymru T. Brimmacombe 839 1.41 Majority 2,342 3.94 Turnout 79.5 Conservative hold Swing General Election February 1974: Monmouth Party Candidate Votes % ±% Conservative John Stradling Thomas 27,269 43.69 Labour F.R. Thompson 22,707 36.38 Liberal D.H. Hando 11,506 18.44 Plaid Cymru E.H. Spanwick 930 1.49 Majority 4,562 7.31 Turnout 84.14 Conservative hold Swing General Election 1970: Monmouth Party Candidate Votes % ±% Conservative John Stradling Thomas 28,312 46.54 Labour J. Anderson 26,957 44.31 Liberal D.H. Hando 4,601 6.68 Plaid Cymru S. K. Neale 1,501 2.47 Majority 1,355 2.23 Turnout 80.46 Conservative gain from Labour Swing Elections in the 1960s
General Election 1966: Monmouth Party Candidate Votes % ±% Labour D. Anderson 28,619 52.73 Conservative Peter Thorneycroft 25,654 47.27 Majority 2,965 5.46 Turnout 84.33 Labour gain from Conservative Swing General Election 1964: Monmouth Party Candidate Votes % ±% Conservative Peter Thorneycroft 22,365 44.11 Labour A.C. Kerr 21,921 42.71 Liberal D.H. Davies 6,764 13.14 Majority 714 1.39 Turnout 84.4 Conservative hold Swing Elections in the 1950s
General Election 1959: Monmouth Party Candidate Votes % ±% General Election 1955: Monmouth Party Candidate Votes % ±% General Election 1951: Monmouth Party Candidate Votes % ±% General Election 1950: Monmouth Party Candidate Votes % ±% Conservative Peter Thorneycroft 21,956 55.33 Labour G.P. Thomas 17,725 44.67 Majority 4,231 10.66 Turnout 83.15 Conservative gain from Labour Swing Elections in the 1940s
Monmouth by-election, October 1945 Party Candidate Votes % ±% Conservative Peter Thorneycroft 21,092 52.7 +0.8 Labour A. B. L. Oakley 18,953 47.3 −0.8 Majority 2,139 5.4 +1.6 Turnout 40,045 39.8 Conservative hold Swing +0.8 General Election July 1945: Monmouth Party Candidate Votes % ±% Conservative Leslie Pym 22,195 51.9 −8.2 Labour A. B. L. Oakley 20,543 48.1 +8.2 Majority 1,652 3.8 −16.4 Turnout 42,738 72.0 +13.8 Conservative hold Swing −8.2 Elections in the 1930s
Monmouth by-election, 1939 Party Candidate Votes % ±% Conservative Leslie Pym 17,358 60.1 −3.3 Labour F. R. Hancock 11,543 39.9 +3.3 Majority 5,815 20.2 −6.6 Turnout 28,901 58.2 −18.6 Conservative hold Swing −3.3 General Election 1935: Monmouth Party Candidate Votes % ±% Conservative John Herbert 23,262 63.4 −1.6 Labour Michael Foot 13,454 36.6 +1.6 Majority 9,808 26.8 −3.2 Turnout 76.8 +7.4 Conservative hold Swing −1.6 Monmouth by-election, 1934 Party Candidate Votes % ±% Conservative John Herbert 20,640 65.0 −5.8 Labour Rev D. Hughes 11,094 35.0 +5.8 Majority 9,546 30.0 −11.6 Turnout 31,734 69.2 −8.8 Conservative hold Swing −5.8 General Election 1931: Monmouth Party Candidate Votes % ±% Conservative Sir Leolin Forestier-Walker 24,829 70.8 +21.5 Labour Rev D. Hughes 10,217 29.2 +4.3 Majority 14,612 41.6 +18.1 Turnout 45,046 78.0 −0.9 Conservative hold Swing See also
Notes and references
- ^ "Beyond 20/20 WDS - Table view". 2011 Electorate Figures. StatsWales. 1 December 2010. http://www.statswales.wales.gov.uk/TableViewer/tableView.aspx?ReportId=14666. Retrieved 13 March 2011.
- ^ Boundary Commission for Wales website
The Parliamentary Constituencies and Assembly Electoral Regions (Wales) Order 2006, OPSI website - ^ a b c d Boundaries of Parliamentary Constituencies 1885-1972 (ISBN 0-900178-09-4), F. W. S. Craig 1972
Craig attributes the 1951 alteration to SI 1851/1390 under section 2(3) of the House of Commons (Redistribution of Seats) Act 1949 - ^ Leigh Rayment's Historical List of MPs – Constituencies beginning with "M" (part 3)
- ^ Monmouth, Monmouthshire County Council - candidates Monmouth
- ^ "Politics Resources". Election 1992. Politics Resources. 9 April 1992. http://www.politicsresources.net/area/uk/ge92/ge92index.htm. Retrieved 6 Dec 2010.
Sources
- Iain Dale, ed (2003). The Times House of Commons 1929, 1931, 1935. Politico's (reprint). ISBN 1-84275-033-X.
- The Times House of Commons 1945. The Times. 1945.
- Craig, F. W. S. (1983) [1969]. British parliamentary election results 1918-1949 (3rd edition ed.). Chichester: Parliamentary Research Services. ISBN 0-900178-06-X.
Parliament of the United Kingdom Preceded by
BromleyConstituency represented by the Chancellor of the Exchequer
1957–1958Succeeded by
TivertonConstituencies in Wales (40) Labour (26) Aberavon · Alyn and Deeside · Blaenau Gwent · Bridgend · Caerphilly · Cardiff South and Penarth · Cardiff West · Clwyd South · Cynon Valley · Delyn · Gower · Islwyn · Llanelli · Merthyr Tydfil and Rhymney · Neath · Newport East · Newport West · Ogmore · Pontypridd · Rhondda · Swansea East · Swansea West · Torfaen · Vale of Clwyd · Wrexham · Ynys Môn
Conservative (8) Liberal Democrats (3) Plaid Cymru (3) Categories:- Parliamentary constituencies in South Wales
- United Kingdom Parliamentary constituencies established in 1918

Wikimedia Foundation. 2010.