- Orpington (UK Parliament constituency)
-
Orpington Borough constituency for the House of Commons 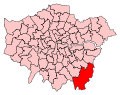
Boundary of Orpington in Greater London for the 2010 general election.County Greater London Electorate 68,221 (December 2010)[1] Current constituency Created 1945 Member of Parliament Jo Johnson (Conservative) Number of members One Created from Chislehurst and Dartford Overlaps European Parliament constituency London  Map showing the wards of the Orpington Parliament Constituency (red) within the London Borough of Bromley (yellow). Cray Valley West (orange) was included in the constituency at the election in 2005 but was transferred to Bromley and Chislehurst in 2010
Orpington is a parliamentary constituency represented in the House of Commons of the Parliament of the United Kingdom. It elects one Member of Parliament (MP) by the first past the post system of election.
Contents
History
Orpington was created in a mini boundary review enacted at the 1945 general election. The seats of Dartford and Chislehurst had both seen their electorate grow enormously since the last review and as an interim measure were divided into four, creating the additional seats of Bexley and Orpington. The seat has changed a little in subsequent boundary reviews since 1945, most recently at the 1997 general election, when the Ravensbourne seat was divided between the three Bromley constituencies, moving Biggin Hill into the existing Orpington seat.
The seat is famous for its 1962 by-election when it was taken in a shock win by the Liberal Party candidate Eric Lubbock.[1].
The current MP is Jo Johnson, first elected in the 2010 general election.
Boundaries
The constituency is located in the London Borough of Bromley, forming the southeastern limits of Greater London and including the urban areas of Orpington, St Mary Cray, most of St Paul's Cray, Farnborough, and Chelsfield and extending through the countryside to Biggin Hill. It is made up of seven electoral wards from the borough:
- Biggin Hill, Chelsfield and Pratts Bottom, Cray Valley East, Darwin, Farnborough and Crofton, Orpington, Petts Wood and Knoll
Boundary review
Following their review of parliamentary representation in South London the Boundary Commission for England made minor changes to the existing constituency of Orpington. Cray Valley West ward was transferred to Bromley and Chislehurst constituency and a small part of Bromley Common and Keston ward was transferred to the revised Beckenham constituency.
Members of Parliament
Election Member [2] Party 1945 Sir Waldron Smithers Conservative 1955 Donald Sumner Conservative 1962 by-election Eric Lubbock Liberal 1970 Ivor Stanbrook Conservative 1992 John Horam Conservative 2010 Jo Johnson Conservative Election results
Elections in the 2010s
General Election 2010: Orpington[3] Party Candidate Votes % ±% Conservative Jo Johnson 29,200 59.7 +8.5 Liberal Democrat David McBride 12,000 24.5 -15.9 Labour Stephen Morgan 4,400 9.0 +3.0 UKIP James Greenhough 1,360 2.8 +0.4 BNP Tess Culnane 1,241 2.5 N/A Green Tamara Galloway 511 1.0 N/A English Democrats Chris Snape 199 0.4 N/A Majority 17,200 35.2 Turnout 48,911 72.2 -0.2 Elections in the 2000s
General Election 2005: Orpington Party Candidate Votes % ±% Conservative John Horam 26,718 48.8 +4.9 Liberal Democrat Chris Maines 21,771 39.8 -3.5 Labour Emily Bird 4,914 9.0 -1.8 UKIP Mick Greenhough 1,331 2.4 +0.4 Majority 4,947 9.0 +8.4 Turnout 54,734 69.9 +5.3 Conservative hold Swing +4.2 General Election 2001: Orpington Party Candidate Votes % ±% Conservative John Horam 22,334 43.9 +3.3 Liberal Democrat Chris Maines 22,065 43.3 +7.7 Labour Chris A. Purnell 5,517 10.8 -7.0 UKIP John B. Youles 996 2.0 +1.1 Majority 269 0.6 -4.3 Turnout 50,912 64.6 -11.7 Conservative hold Swing -2.2 Elections in 1990s
General Election 1997: Orpington Party Candidate Votes % ±% Conservative John Horam 24,417 40.6 -16.6 Liberal Democrat Chris Maines 21,465 35.7 +5.5 Labour Sue Polydorou 10,753 17.9 +6.4 Referendum Party David Clark 2,316 3.8 N/A UKIP J. Carver 526 0.9 N/A Liberal Robin Almond 494 0.8 -0.3 ProLife Alliance Nicholas Wilton 191 0.3 N/A Majority 2,952 4.9 -22.1 Turnout 60,162 76.3 -7.4 Conservative hold Swing -11.0 General Election 1992: Orpington Party Candidate Votes % ±% Conservative John Horam 27,421 57.2 -1.0 Liberal Democrat Chris Maines 14,486 30.2 -0.8 Labour Stephen J. Cowan 5,512 11.5 +0.8 Liberal Robin Almond 539 1.1 N/A Majority 12,935 27.0 -0.2 Turnout 47,958 83.7 +5.2 Conservative hold Swing -0.1 Elections in 1980s
General Election 1987: Orpington Party Candidate Votes % ±% Conservative Ivor Stanbrook 27,261 58.2 +0.9 SDP–Liberal Alliance (Liberal) Jonathan H. Fryer 14,529 31.0 -3.5 Labour S.J. Cowan 5,020 10.7 +3.0 Majority 12,732 27.2 +4.5 Turnout 46,810 78.5 +2.5 Conservative hold Swing +2.2 General Election 1983: Orpington Party Candidate Votes % ±% Conservative Ivor Stanbrook 25,569 57.3 -0.7 SDP–Liberal Alliance (Liberal) J.W. Cook 15,418 34.5 +5.5 Labour D.M. Bean 3,439 7.7 -4.2 BNP L. T. Taylor 215 0.5 N/A Majority 10,151 22.7 -6.3 Turnout 44,641 76.0 -5.7 Conservative hold Swing -3.2 Elections in 1970s
General Election 1979: Orpington Party Candidate Votes % ±% Conservative Ivor Stanbrook 32,150 58.0 +11.0 Liberal J.W. Cook 16,074 29.0 -8.4 Labour A.J. Weyman 6,581 11.9 -3.8 National Front F. Hitches 516 0.9 N/A Homeland Party I. MacKillian 146 0.3 N/A Majority 16,076 29.0 +19.3 Turnout 55,467 81.7 +2.7 Conservative hold Swing +9.6 General Election October 1974: Orpington Party Candidate Votes % ±% Conservative Ivor Stanbrook 24,394 47.0 -0.2 Liberal Lady Avebury 19,384 37.3 -3.4 Labour C. Spillane 8,121 15.6 +3.5 Majority 5,010 9.7 +3.1 Turnout 51,899 79.0 -7.1 Conservative hold Swing +1.6 General Election February 1974: Orpington Party Candidate Votes % ±% Conservative Ivor Stanbrook 26,435 47.2 -0.1 Liberal R. Young 22,771 40.7 -4.0 Labour D. Grant 6,752 12.1 +4.1 Majority 3,664 6.6 +4.0 Turnout 55,598 86.1 +7.0 Conservative hold Swing +2.0 General Election 1970: Orpington Party Candidate Votes % ±% Conservative Ivor Stanbrook 24,385 47.3 +4.0 Liberal Eric Lubbock 23,063 44.7 -2.0 Labour D. Grant 4,098 8.0 -2.1 Majority 1,322 2.6 Turnout 51,546 79.1 -7.9 Conservative gain from Liberal Swing +3.0 Elections in 1960s
General Election 1966: Orpington Party Candidate Votes % ±% Liberal Eric Lubbock 22,615 46.7 -1.7 Conservative Norris McWhirter 20,993 43.3 +1.5 Labour D. Sleigh 4,870 10.1 +0.2 Majority 1,622 3.4 -3.2 Turnout 48,478 87.0 +1.6 Liberal hold Swing -1.6 General Election 1964: Orpington Party Candidate Votes % ±% Liberal Eric Lubbock 22,637 48.4 -4.5 Conservative Norris McWhirter 19,565 41.8 +7.1 Labour P. Merriton 4,609 9.9 -2.5 Majority 3,072 6.6 -11.6 Turnout 46,811 87.0 Liberal hold Swing -5.8 Orpington by-election, 1962 Party Candidate Votes % ±% Liberal Eric Lubbock 22,846 52.9 +30.7 Conservative Peter Goldman 14,991 34.7 -21.9 Labour Alan Jinkinson 5,350 12.4 -9.8 Majority 7,855 18.2 -16.2 Turnout 43,187 Liberal gain from Conservative Swing +26.3 Elections in 1950s
General Election 1959: Orpington Party Candidate Votes % ±% Conservative Donald Sumner 24,303 56.6 -3.3 Labour N. Hart 9,543 22.2 -5.4 Liberal Jack Galloway 9,092 21.2 +8.7 Majority 14,760 34.4 +1.1 Turnout 42,938 82.8 +3.4 Conservative hold Swing +0.6 General Election 1955: Orpington Party Candidate Votes % ±% Conservative Donald Sumner 22,166 59.9 -2.8 Labour N. J. Hart 10,230 27.6 -9.8 Liberal Alfred B. Howard 4,610 12.5 N/A Majority 11,936 32.3 +7.0 Turnout 37,006 79.4 -2.6 Conservative hold Swing +3.5 Orpington by-election, 1955 Party Candidate Votes % ±% Conservative Donald Sumner 20,082 65.83 Labour R. Vaughan Williams 10,426 34.17 Majority 9,656 31.7 Turnout 30,508 55.39 Conservative hold Swing +3 General Election 1951: Orpington Party Candidate Votes % ±% Conservative Sir Waldron Smithers 27,244 62.7 +6.0 Labour R.D. Vaughan Williams 16,241 37.4 +4.6 Majority 11,003 25.3 +1.4 Turnout 43,485 82.0 -3.1 Conservative hold Swing +0.7 General Election 1950: Orpington Party Candidate Votes % ±% Conservative Sir Waldron Smithers 24,450 56.7 +8.1 Labour George H. C. Vaughan 14,161 32.8 -5.0 Liberal Lady Ruth Abrahams 4,523 10.5 -1.8 Majority 10,289 23.9 +13.1 Turnout 43,134 85.1 +12.4 Conservative hold Swing Elections in 1940s
General Election 1945: Orpington Party Candidate Votes % ±% Conservative Sir Waldron Smithers 20,388 48.6 N/A Labour A.R. Mais 15,846 37.8 N/A Liberal E.R. Goodfellow 5,140 12.3 N/A Independent G.C. Milner 528 1.3 N/A Majority 4,542 10.8 N/A Turnout 41,902 72.7 N/A Conservative win (new seat) See also
Footnotes
- ^ "Electorate Figures - Boundary Commission for England". 2011 Electorate Figures. Boundary Commission for England. 4 March 2011. http://www.boundarycommissionforengland.org.uk/electoral-figures/electoral-figures.htm. Retrieved 13 March 2011.
- ^ Leigh Rayment's Historical List of MPs – Constituencies beginning with "O"
- ^ "Orpington". UK Polling Report. http://ukpollingreport.co.uk/guide/seat-profiles/orpington. Retrieved 1 February 2010.
References
- British Parliamentary Election Results 1918-1949, compiled and edited by F.W.S. Craig (Macmillan Press, revised edition 1977)
External links
- UK Constituency Maps
- BBC Vote 2001 Includes 1997 and 2001 results
- BBC Election 2005
- Political Science Resources
Categories:- Politics of Bromley
- Parliamentary constituencies in London
- United Kingdom Parliamentary constituencies established in 1945


Wikimedia Foundation. 2010.