- Demographics of New York City
-
 Population growth (blue) and population loss (red) from 1990 to 2000. (Click on image to see full key and data.)
The demographics of New York City are evidence of a large and ethnically diverse metropolis. It is the largest city in the United States with a population defined by a long history of international immigration. New York City is home to more than 8 million people, accounting for about 40% of the population of New York State and a similar percentage of the New York metropolitan area, home to about 20 million. Over the last decade the city has been growing faster than the region. The New York region continues to be the leading metropolitan gateway for legal immigrants admitted into the United States.[1]
Throughout its history New York City has been a major point of entry for immigrants; the term "melting pot" was coined to describe densely populated immigrant neighborhoods on the Lower East Side. As many as 800 languages are spoken in New York, making it the most linguistically diverse city in the world.[2] English remains the most widely spoken language and New York is one of the largest cities in the English-speaking world, although there are areas of Queens and Brooklyn in which up to 20% of people speak English only a little or not at all. Neighborhoods such as Flushing, Sunset Park and Corona are the least English-speaking communities.
New York's five boroughs overviewJurisdiction Population Land area Borough of County of 1 April 2010
Censussquare
milessquare
kmManhattan New York 1,585,873 23 59 The Bronx Bronx 1,385,108 42 109 Brooklyn Kings 2,504,700 71 183 Queens Queens 2,230,722 109 283 Staten Island Richmond 468,730 58 151 8,175,133 303 786 19,378,102 47,214 122,284 Source: United States Census Bureau[3][4][5] Contents
Population
Historical populations Year Pop. ±% 1698 4,937 — 1712 5,840 +18.3% 1723 7,248 +24.1% 1737 10,664 +47.1% 1746 11,717 +9.9% 1756 13,046 +11.3% 1771 21,863 +67.6% 1790 33,131 +51.5% 1800 60,515 +82.7% 1810 96,373 +59.3% 1820 123,706 +28.4% 1830 202,589 +63.8% 1840 312,710 +54.4% 1850 515,547 +64.9% 1860 813,669 +57.8% 1870 942,292 +15.8% 1880 1,206,299 +28.0% 1890 1,515,301 +25.6% 1900 3,437,202 +126.8% 1910 4,766,883 +38.7% 1920 5,620,048 +17.9% 1930 6,930,446 +23.3% 1940 7,454,995 +7.6% 1950 7,891,957 +5.9% 1960 7,781,984 −1.4% 1970 7,894,862 +1.5% 1980 7,071,639 −10.4% 1990 7,322,564 +3.5% 2000 8,008,288 +9.4% 2010 8,175,133 +2.1% 1880 & 1890 figures include part of the Bronx. Beginning with 1900, figures are for consolidated city of five boroughs. For the same area before 1900, see #Historic population figures, below. Sources: 1698–1771,[6] 1790–1990,[7] 2000 and 2010 Censuses [3] New York is the most populous city in the United States, with 2010 population of 8,175,133 (up from 8.0 million in 2000 and 7.3 million in 1990).[3] New York's two key demographic features are its population density and cultural diversity. The city's population density of 26,403 people per square mile (10,194/km²), makes it the densest of any American municipality with a population above 100,000.[8] Manhattan's population density is 66,940 people per square mile (25,846/km²), highest of any county in the United States.[9][10]
New York City is multicultural. About 36% of the city's population is foreign-born.,[11] one of the highest among US cities. The ten nations constituting the largest sources of modern immigration to New York City are the Dominican Republic, China, Jamaica, Guyana, Mexico, Ecuador, Haiti, Trinidad and Tobago, Colombia, and Russia.[12]
The New York City metropolitan area is home to the largest Jewish community outside Israel.[13] It is also home to nearly a quarter of the nation's Indian Americans and 15% of all Korean Americans;[14][15] the largest African American community of any city in the country; and including 6 Chinatowns in the city proper,[16] comprised as of 2008 a population of 659,596 overseas Chinese,[17] the largest outside of Asia. New York City alone, according to the 2010 Census, has now become home to more than one million Asian Americans, greater than the combined totals of San Francisco and Los Angeles.[18] New York contains the highest total Asian population of any U.S. city proper.[19] 6.0% of New York City is of Chinese ethnicity, with about forty percent of them living in the borough of Queens alone. Koreans make up 1.2% of the city's population, and Japanese at 0.3%. Filipinos are the largest southeast Asian ethnic group at 0.8%, followed by Vietnamese who make up only 0.2% of New York City's population. Indians are the largest South Asian group, comprising 2.4% of the city's population, and Bangladeshis and Pakistanis at 0.7% and 0.5%, respectively.[20]
The nine largest ethnic groups as of the 2005 census estimates are: African, Puerto Ricans, Italians, West Indians, Dominicans, Chinese, Irish, Russian, and German.[21][22] The Puerto Rican population of New York City is the largest outside Puerto Rico.[23] Italians emigrated to the city in large numbers in the early 20th century, establishing several "Little Italies". The Irish also have a notable presence, along with Germans.
New York City has a high degree of income variation. In 2005 the median household income in the highest census tract was reported to be $188,697, while in the lowest it was $9,320.[24] The variance is driven by wage growth in high income brackets, while wages have stagnated for middle and lower income brackets. In 2006 the average weekly wage in Manhattan was $1,453, the highest and fastest growing among the largest counties in the United States.[25] The borough is also experiencing a "baby boom" among the wealthy that is unique among U.S. cities. Since 2000, the number of children under age 5 living in Manhattan has grown by more than 32%.[26]
In 2000, about 3 out of every 10 New York City housing units were owner-occupied, compared to about 2 owner-occupied units out of every 3 units in the U.S. as a whole.[27] Rental vacancy is usually between 3% and 4.5%, well below the 5% threshold defined to be a housing emergency, justifying the continuation of rent control and rent stabilization. About 33% of rental units fall under rent stabilization, according to which increases are adjudicated periodically by city agencies. Rent control covers only a very small number of rental units.[28] Some critics point to New York City's strict zoning and other regulations as partial causes for the housing shortage, but during the city's decline in population from the 1960s through the 1980s, a large number of apartment buildings suffered suspected arson fires or were abandoned by their owners. Once the population trend was reversed, with rising prospects for rentals and sales, new construction has resumed, but generally for higher income brackets.
New York is the largest city in the United States, with the city proper's population more than double the next largest city, Los Angeles (or roughly equivalent to the combined populations of Los Angeles, Chicago, and Houston, the United States' second, third, and fourth most populous cities respectively). The city has a population more than that of 39 U.S. states.[29] The estimated 2009 population of New York City is 8,391,881 (up from 7.072 million in 1980).[7][30] This amounts to about 40% of New York State's population and a similar percentage of the metropolitan regional population. Over the last decade the city has been growing rapidly. Demographers estimate New York's population will reach between 9.4 and 9.7 million by 2030.[31] In 2000 the reported life expectancy of New Yorkers was above the national average. Life expectancy for females born in 2009 in New York City is 80.2 years and for males is 74.5 years.[32]
New York City compared 2010
Census DataNew York City Los Angeles Chicago New York State United States Total population 8,175,133 3,792,820 2,695,598 19,378,102 308,745,538 Population, percent change,
2000 to 2010+2.1% +2.6% -6.9% +2.1% +9.7% Population density 27,012
/sq. mi.8,092
/sq. mi.11,864
/sq. mi.408,7
/sq. mi.87,4
/sq. mi.Median household income (1999) $38,293 $36,687 $38,625 $43,393 $41,994 Per capita income (1999) $22,402 $20,671 $20,175 $23,389 $21,587 Bachelor's degree or higher 27% 26% 26% 27% 24% Foreign born 36% 41% 21.7% 20% 13% White 44.6% 49.8% 45.0% 66.4% 72.4% Black 25.1% 9.6% 32.9% 15.5% 12.6% Hispanic
(any race)27.5% 48.5% 28.9% 17.3% 16.3% Asian 11.8% 11.3% 5.5% 5.9% 4.8% New York's two key demographic features are its density and diversity. The city has an extremely high population density of 26,403 people per square mile (10,194/km²), about 10,000 more people per square mile than the next densest large American city, San Francisco.[33] Manhattan's population density is 66,940 people per square mile (25,846/km²).[10]
The city has a long tradition of attracting international immigration and Americans seeking careers in certain sectors. As of 2006, New York City has ranked number one for seven consecutive years as the city most U.S. residents would most like to live in or near.[34]
Immigration
Throughout its history New York City has been a principal entry point for immigration to the United States. These immigrants often form ethnic enclaves, neighborhoods dominated by one ethnicity. The city experienced major immigration from Europe in the 19th century and another major wave in the early 20th century. Since the passage of the Immigration and Nationality Act of 1965, and particularly since the 1980s, New York City has seen renewed rates of high immigration. Newer immigrants are from Latin America, the Caribbean, Asia, Eastern Europe and Africa. 36% of the city's population is foreign-born.[11] Among U.S. cities, this proportion is higher only in Los Angeles and Miami.[10] In New York no single country or region of origin dominates. The ten largest countries of origin are the Dominican Republic, China, Jamaica, Guyana, Mexico, Ecuador, Haiti, Trinidad and Tobago, Colombia, and Russia.[35] About 170 languages are spoken in the city.[36] Between 1990 and 2000 the city admitted 1,224,524 immigrants.[37] Demographers and city officials have observed that immigration to New York City has been slowing since 1997. This is mostly due to more and more immigrants choosing directly to locate to the city's suburbs and then commute to the city or work in many of its booming edge cities like Fort Lee, NJ, Jersey City, Morristown, NJ, Stamford, CT, White Plains, NY and others. Despite the slowdown in immigration the city's overall immigrant population has continued to increase and in 2006 it numbered 3.038 million (37.0%) up from 2.871 million (35.9%) in 2000.[38][39]
See also: Demographic profile of New York CityAfrican Americans make up 25.1% of New York City's population. According to the survey, there were 2,086,566 African Americans residing in New York City. Percentage wise, approximately two out of every five black residents of New York City resides in Brooklyn (primarily in the Central, Northern, and Eastern sections of the borough), one out of every five resides in Bronx (mainly in the borough's Northeastern, Southeastern and Southern sections) one out of every five resides in Queens (mainly in the borough's Southeastern area), with the remaining black residents residing in Manhattan (primarily in Harlem) and Staten Island (mainly the North Shore of the borough).
Native Americans make up 0.4% of New York City's population. According to the survey, there were 29,569 Native Americans residing in New York City. Of 29,569 Native Americans, 2,075 were of the Cherokee tribal grouping. In addition, 213 were of the Navajo tribal grouping. Also, 42 people identified themselves as Chippewa, and 47 people identified themselves as Sioux.
Asian Americans make up 11.8% of New York City's population. According to the survey, there were 976,807 Asian Americans residing in New York City. Of 976,807 Asian Americans, 445,145 were of Chinese descent, representing 5.4% of the city's population. In addition, there were 226,888 Indian Americans residing in the city, representing 2.7% of the population. Approximately 103,660 people identified themselves as "Other Asian", a category that includes people of Cambodian, Laotian, Hmong, and Pakistani descent. Individuals in this category represent 1.2% of the city's population. There were 88,162 Korean Americans residing in the city, representing 1.1% of the population. Other Asian American groups include those of Filipino (68,826, 0.8%), Japanese (26,096, 0.3%), and Vietnamese (18,030, 0.2%) descent.
Pacific Islander Americans make up 0.1% of New York City's population. According to the survey, there were 4,941 Pacific Islander Americans residing in New York City. Of 4,941 Pacific Islander Americans, 1,992 were Native Hawaiian. Approximately 904 were of Samoan descent, and 504 were of Guamanian descent. In addition, 1,541 were of other Pacific Islander ancestries.
Multiracial Americans make up 2.1% of New York City's population. According to the survey, there were 177,643 multiracial Americans residing in New York City. People of black and white ancestry numbered at 37,124, making up 0.4% of the population. People of white and Asian ancestry numbered at 22,242, making up 0.3% of the population. People of white/Native American ancestry (10,762) and black/Native American ancestry (10,221) each made up 0.1% of the city's population.
Hispanics and Latinos make up 27.5% of New York City's population. According to the American Community Survey, there were 2,287,905 Hispanic or Latino Americans residing in New York City. The Hispanic/Latino population is categorized with four groups, "Mexican" (297,581 or 3.6%), "Puerto Rican" (785,618 or 9.4%), "Cuban" (42,377 or 0.5%), and "Other Hispanic or Latino" (1,165,576 or 14.0%).[40]
According to the 2006-2007 Center for Latin American, Caribbean & Latino Studies:[41]
- Puerto Rican: (778,628)
- Dominican: (602,093)
- Mexican: (289,755)
- Ecuadorian: (201,708)
- Colombian: (113,469)
- Other Hispanic or Latino: (351,635)
White Americans make up 44.6% of New York City's population. According to the survey, there were 3,704,243 White Americans residing in New York City. White Americans of non-Hispanic origin make up 35.1% of the city's population. There are 2,918,976 non-Hispanic whites residing in the city. Much of New York City's European American population consists of individuals of Italian, Irish, German, Russian, Polish, English, and Greek ancestry.
Source:[42]
NOTE: This source contains all of the numerical information in the data above.
According to the 2006-2008 American Community Survey, the top ten White, European ancestries were the following:[43]
- Italian: 8.2% (684,230)
- Irish: 5.3% (443,364)
- German: 3.6% (296,901)
- Russian: 3.1% (260,821)
- Polish: 2.8% (237,919)
- English: 1.9% (160,472)
- Greek: 1.0% (83,575)
- French: 0.9% (73,587)
- Hungarian: 0.7% (59,225)
- Ukrainian: 0.6% (49,643)
Other smaller European ancestries include:
- Scottish: 0.5% (41,787)
- Scotch-Irish: 0.3% (28,770)
- Dutch: 0.3% (24,776)
- Norwegian: 0.3% (24,737)
- Swedish: 0.3% (22,206)
Source:[43].
According to a 2001 study by Claritas, four of the city's five boroughs ranked among the nation's twenty most diverse counties. Queens ranked 1st, Brooklyn 3rd, Manhattan 7th, and The Bronx 17th. In addition, Hudson County and Essex County, New Jersey, both of which are part of the New York Metropolitan Area, ranked 6th and 15th, respectively.[44]
The city has several demographically unique characteristics. Queens is the only large county in the United States where the median income among black households, about $52,000 a year, has surpassed that of whites.[45] It is also the nation's most ethnically diverse county.[46]
The New York City metropolitan area is home to the largest Jewish community outside Israel.[47] It is also home to nearly a quarter of the nation's Indian American population,[48] and the largest African American community of any city in the country. New York City, with about 800,000 Puerto Rican residents, has the largest Puerto Rican population outside of Puerto Rico. Another historically significant ethnic group are Italians, who emigrated to the city in large numbers in the early 20th century. New York City is home to the largest Italian American population in the United States. The Irish and Germans also have a notable presence.
% Foreign born by borough 1970-2006 Borough
1970
1980
1990
2000
2006Brooklyn 17.5 23.8 29.2 37.8 37.8 Queens 21.0 28.6 36.2 46.1 48.5 Manhattan 20.0 24.4 25.8 29.4 28.7 Bronx 15.6 18.4 22.8 29.0 31.8 Staten Island 9.0 9.8 11.8 16.4 20.9 Total 18.2 23.6 28.4 35.9 37.0 Source: NYC.gov[49] Jurisdiction Population
2000
census%
white%
black
or
African
American%
Asian%
Other%
mixed
race%
Hispanic/
Latino
of any
race%
Catholic% not
affiliated%
Jewish%
ProtestantEstimate
of % not
reportingRace Ethnicity Religious groups Brooklyn 2,465,326 41.2 36.4 7.5 10.6 4.3 19.8 37 4 15 8 33 Queens 2,229,379 44.1 20.0 17.6 12.3 6.1 25.0 29 37 11 5 15 Manhattan 1,537,195 54.4 17.4 9.4 14.7 4.1 27.2 37 11 20 9 19 Bronx 1,332,650 29.9 35.6 3.0 25.7 5.8 48.4 44 14 6 5 29 Staten Island 443,728 77.6 9.7 5.7 4.3 2.7 12.1 60 11 8 5 14 NYC Total 8,008,278 44.7 26.6 9.8 14.0 4.9 27.0 37 17 13 6 24 NY State 18,976,457 67.9 15.9 5.5 7.5 3.1 15.1 42 20 9 10 16 USA 281,421,906 75.1 12.3 3.6 6.5 2.4 12.5 22 37 2 23 12 Source: 2000 Census[50] American Indian, Native Alaskan, Native Hawaiian, and Pacific Islander make up 2.9% of the population of NYC, and have been included with "Other".
Source for religious groups: ARDA[51] Households
The 2000 census counted 3,021,588 households with a median income of $38,293. 30% of households had children under the age of 18, and 37% were married couples living together. 19% had a single female householder, and 39% were non-families. 32% of all households were made up of individuals, and 10% were single residents 65 years of age or older. The average household size was 2.59 persons, and the average family size was 3.32.
The age range was as follows: 24% were under the age of 18, 10% between 18 and 24, 33% between 25 to 44, 21% between 45 to 64, and 12% were 65 or older. The median age in New York City in 2000 was 34 years. For every 100 females there were 90 males. For every 100 females age 18 and over, there were 86 males.
The borough of Manhattan is experiencing a "baby boom" that is unique among U.S. cities. Since 2000, the number of children under age 5 living in Manhattan has grown by more than 32%.[52] The increase is driven mostly by affluent white families with median household incomes over $300,000.
Income
Overall, nominal household income in New York City is characterized by large variations. This phenomenon is especially true of Manhattan, which in 2005 was home to the highest incomes U.S. census tract, with a household income of $188,697, as well as the lowest, where household income was $9,320.[53] The disparity is driven in part by wage growth in high income brackets. In 2006 the average weekly wage in Manhattan was $1,453, the highest among the largest counties in the United States.[25] Wages in Manhattan were the fastest growing among the nation's 10 largest counties.[25] Among young adults in New York who work full time, women now earn more money than men — approximately $5,000 more in 2005.[54] Nationally, women's wages still lag behind men.
New York City's borough of Manhattan is the highest nominal income county in the United States. In particular, ZIP code 10021 on Manhattan's Upper East Side, with more than 100,000 inhabitants and a per capita income of over $90,000, has one of the largest concentrations of income in the United States. The other boroughs, especially Queens and Staten Island, have large middle-class populations.
New York City's per capita income in 2000 was $22,402; men and women had a median income of $37,435 and $32,949 respectively. 21.2% of the population and 18.5% of families had incomes below the federal poverty line; 30.0% of this group were under the age of 18 and 17.8% were 65 and older.
The New Yorker with the highest income is oil magnate David H. Koch whose net worth an estimated $17 billion in October 2007.[55] Of Forbes Magazine's 400 richest Americans, 72 live in New York City, and they are each worth at least $1 billion.[55] New York City's present mayor, Michael Bloomberg, is himself one of the nation's richest men. As of 2009 New York has regained the number one spot as the city with most billionaires (55), after losing out to Moscow in 2008.
Area Median
House-
hold
IncomeMean
House-
hold
IncomePercent-
age in
PovertyBronx $34,156 $46,298 27.1% Brooklyn $41,406 $60,020 21.9% Manhattan $64,217 $121,549 17.6% Queens $53,171 $67,027 12.0% Staten Island $66,985 $81,498 9.8% New York City $48,631 $75,809 18.5% New York State $53,514 $77,865 13.7% United States $50,140 $69,193 13.0% Projections
New York has ranked first in population among American cities since the first census in 1790. New York will maintain this position, although there are varying forecasts on how much the population will increase. The most realistic population projections from the Department of City Planning anticipate a 1.1 million increase by 2030, bringing the city's population total to 9.1 million.
While the city's projected 2030 population will be a new high, only two boroughs, Staten Island and Queens have reached their population peak every year for the last 5 years. The study projects that by 2030, Queens will have 2.57 million people and Staten Island 552,000. Manhattan, with 1.83 million, Bronx with 1.46 million and Brooklyn with 2.72 million, will still be below their population peaks.[56]
Disputed 2010 Census data
On March 27, 2011, New York City Mayor Michael Bloomberg announced that the city would file a formal challenge to the Census results, as a result of alleged undercounting in the boroughs of Queens and Brooklyn.[57] The mayor has asserted that the numbers for Queens and Brooklyn, the two most populous boroughs, are implausible.[58] According to the Census, they grew by only 0.1% and 1.6%, respectively, while the other boroughs grew by between 3% and 5%. In addition, the Mayor claims, the census showed improbably high amounts of vacant housing in vital neighborhoods such as Jackson Heights, Queens.
Historical data
Historical Population of the present area of New York City and its boroughs * [30][59][60][3] Year Manhattan Brooklyn Queens Bronx Staten Is. Total 1698 4,937 2,017 n/a n/a 727 1771 21,863 3,623 n/a n/a 2,847 1790 33,131 4,549 6,159 1,781 3,827 49,447 1800 60,515 5,740 6,642 1,755 4,563 79,215 1810 96,373 8,303 7,444 2,267 5,347 119,734 1820 123,706 11,187 8,246 2,782 6,135 152,056 1830 202,589 20,535 9,049 3,023 7,082 242,278 1840 312,710 47,613 14,480 5,346 10,965 391,114 1850 515,547 138,882 18,593 8,032 15,061 696,115 1860 813,669 279,122 32,903 23,593 25,492 1,174,779 1870 942,292 419,921 45,468 37,393 33,029 1,478,103 1880 1,164,673 599,495 56,559 51,980 38,991 1,911,698 1890 1,441,216 838,547 87,050 88,908 51,693 2,507,414 †1900 1,850,093 1,166,582 152,999 200,507 67,021 3,437,202 1910 2,331,542 1,634,351 284,041 430,980 85,969 4,766,883 1920 2,284,103 2,018,356 469,042 732,016 116,531 5,620,048 1930 1,867,312 2,560,401 1,079,129 1,265,258 158,346 6,930,446 1940 1,889,924 2,698,285 1,297,634 1,394,711 174,441 7,454,995 1950 1,960,101 2,738,175 1,550,849 1,451,277 191,555 7,891,957 1960 1,698,281 2,627,319 1,809,578 1,424,815 221,991 7,781,984 1970 1,539,233 2,602,012 1,986,473 1,471,701 295,443 7,894,862 1980 1,428,285 2,230,936 1,891,325 1,168,972 352,121 7,071,639 1990 1,487,536 2,300,664 1,951,598 1,203,789 378,977 7,322,564 2000 1,537,195 2,465,326 2,229,379 1,332,650 443,728 8,008,278 2010 1,585,873 2,504,700 2,230,722 1,385,108 468,730 8,175,133 * All population figures are consistent with present-day boundaries.
† First census after the consolidation of the five boroughsEthnicities
African
 125th Street in Harlem, an African American cultural center.
According to the 2000 Census, New York City has the largest population of self-defined black residents of any U.S. city, with over 2 million within the city's boundaries. New York City had more Black people than the entire state of California until the 2000 Census. Many of the city's black residents live in Brooklyn and The Bronx. Several of the city's neighborhoods are historical birthplaces of urban black culture in America, among them the Brooklyn neighborhood of Bedford–Stuyvesant and Manhattan's Harlem and various sections of Eastern Queens and The Bronx. Bedford-Stuyvesant is considered to have the highest concentration of black residents in the United States. New York City has the largest population of black immigrants (at 686,814) and descendants of immigrants from the Caribbean (especially from Jamaica, Trinidad and Tobago, Barbados, Guyana, Belize, Grenada, and Haiti), and of sub-Saharan Africans. In a news item of April 3, 2006, however, the New York Times noted that for the first time since the American Civil War, the recorded African American population was declining, because of emigration to other regions, a declining African American birthrate in New York, and decreased immigration of blacks from the Caribbean and Africa.[61]
In 2005, the median income among black households in Queens was almost $52,000 a year, surpassing that of whites. However, while some of this is because of middle class African American neighborhoods in Queens it also is because of white emigration from Queens and comparison to elderly whites who are left behind who may be on retirement or fixed incomes and no longer working.[62]
Asian
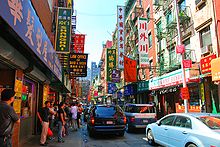
Chinese
 An intersection in Manhattan Chinatown
The New York metropolitan area contains the largest ethnic Chinese population outside of Asia, enumerating 659,596 individuals as of the 2008 American Community Survey Census statistical data,[63] including at least six Chinatowns, comprising the original Manhattan Chinatown, two in Queens (the Flushing Chinatown and the Elmhurst Chinatown), two in Brooklyn (the Sunset Park Chinatown and the Avenue U Chinatown), and one in Edison, New Jersey, not to mention fledgling ethnic Chinese enclaves emerging throughout the New York metropolitan area. Chinese Americans, as a whole, have had a (relatively) long tenure in New York City. The first Chinese immigrants came to Lower Manhattan around 1870, looking for the "gold" America had to offer.[64] By 1880, the enclave around Five Points was estimated to have from 200 to as many as 1,100 members.[64] However, the Chinese Exclusion Act, which went into effect in 1882, caused an abrupt decline in the number of Chinese who immigrated to New York and the rest of the United States.[64] Later, in 1943, the Chinese were given a small quota, and the community's population gradually increased until 1968, when the quota was lifted and the Chinese American population skyrocketed.[64]
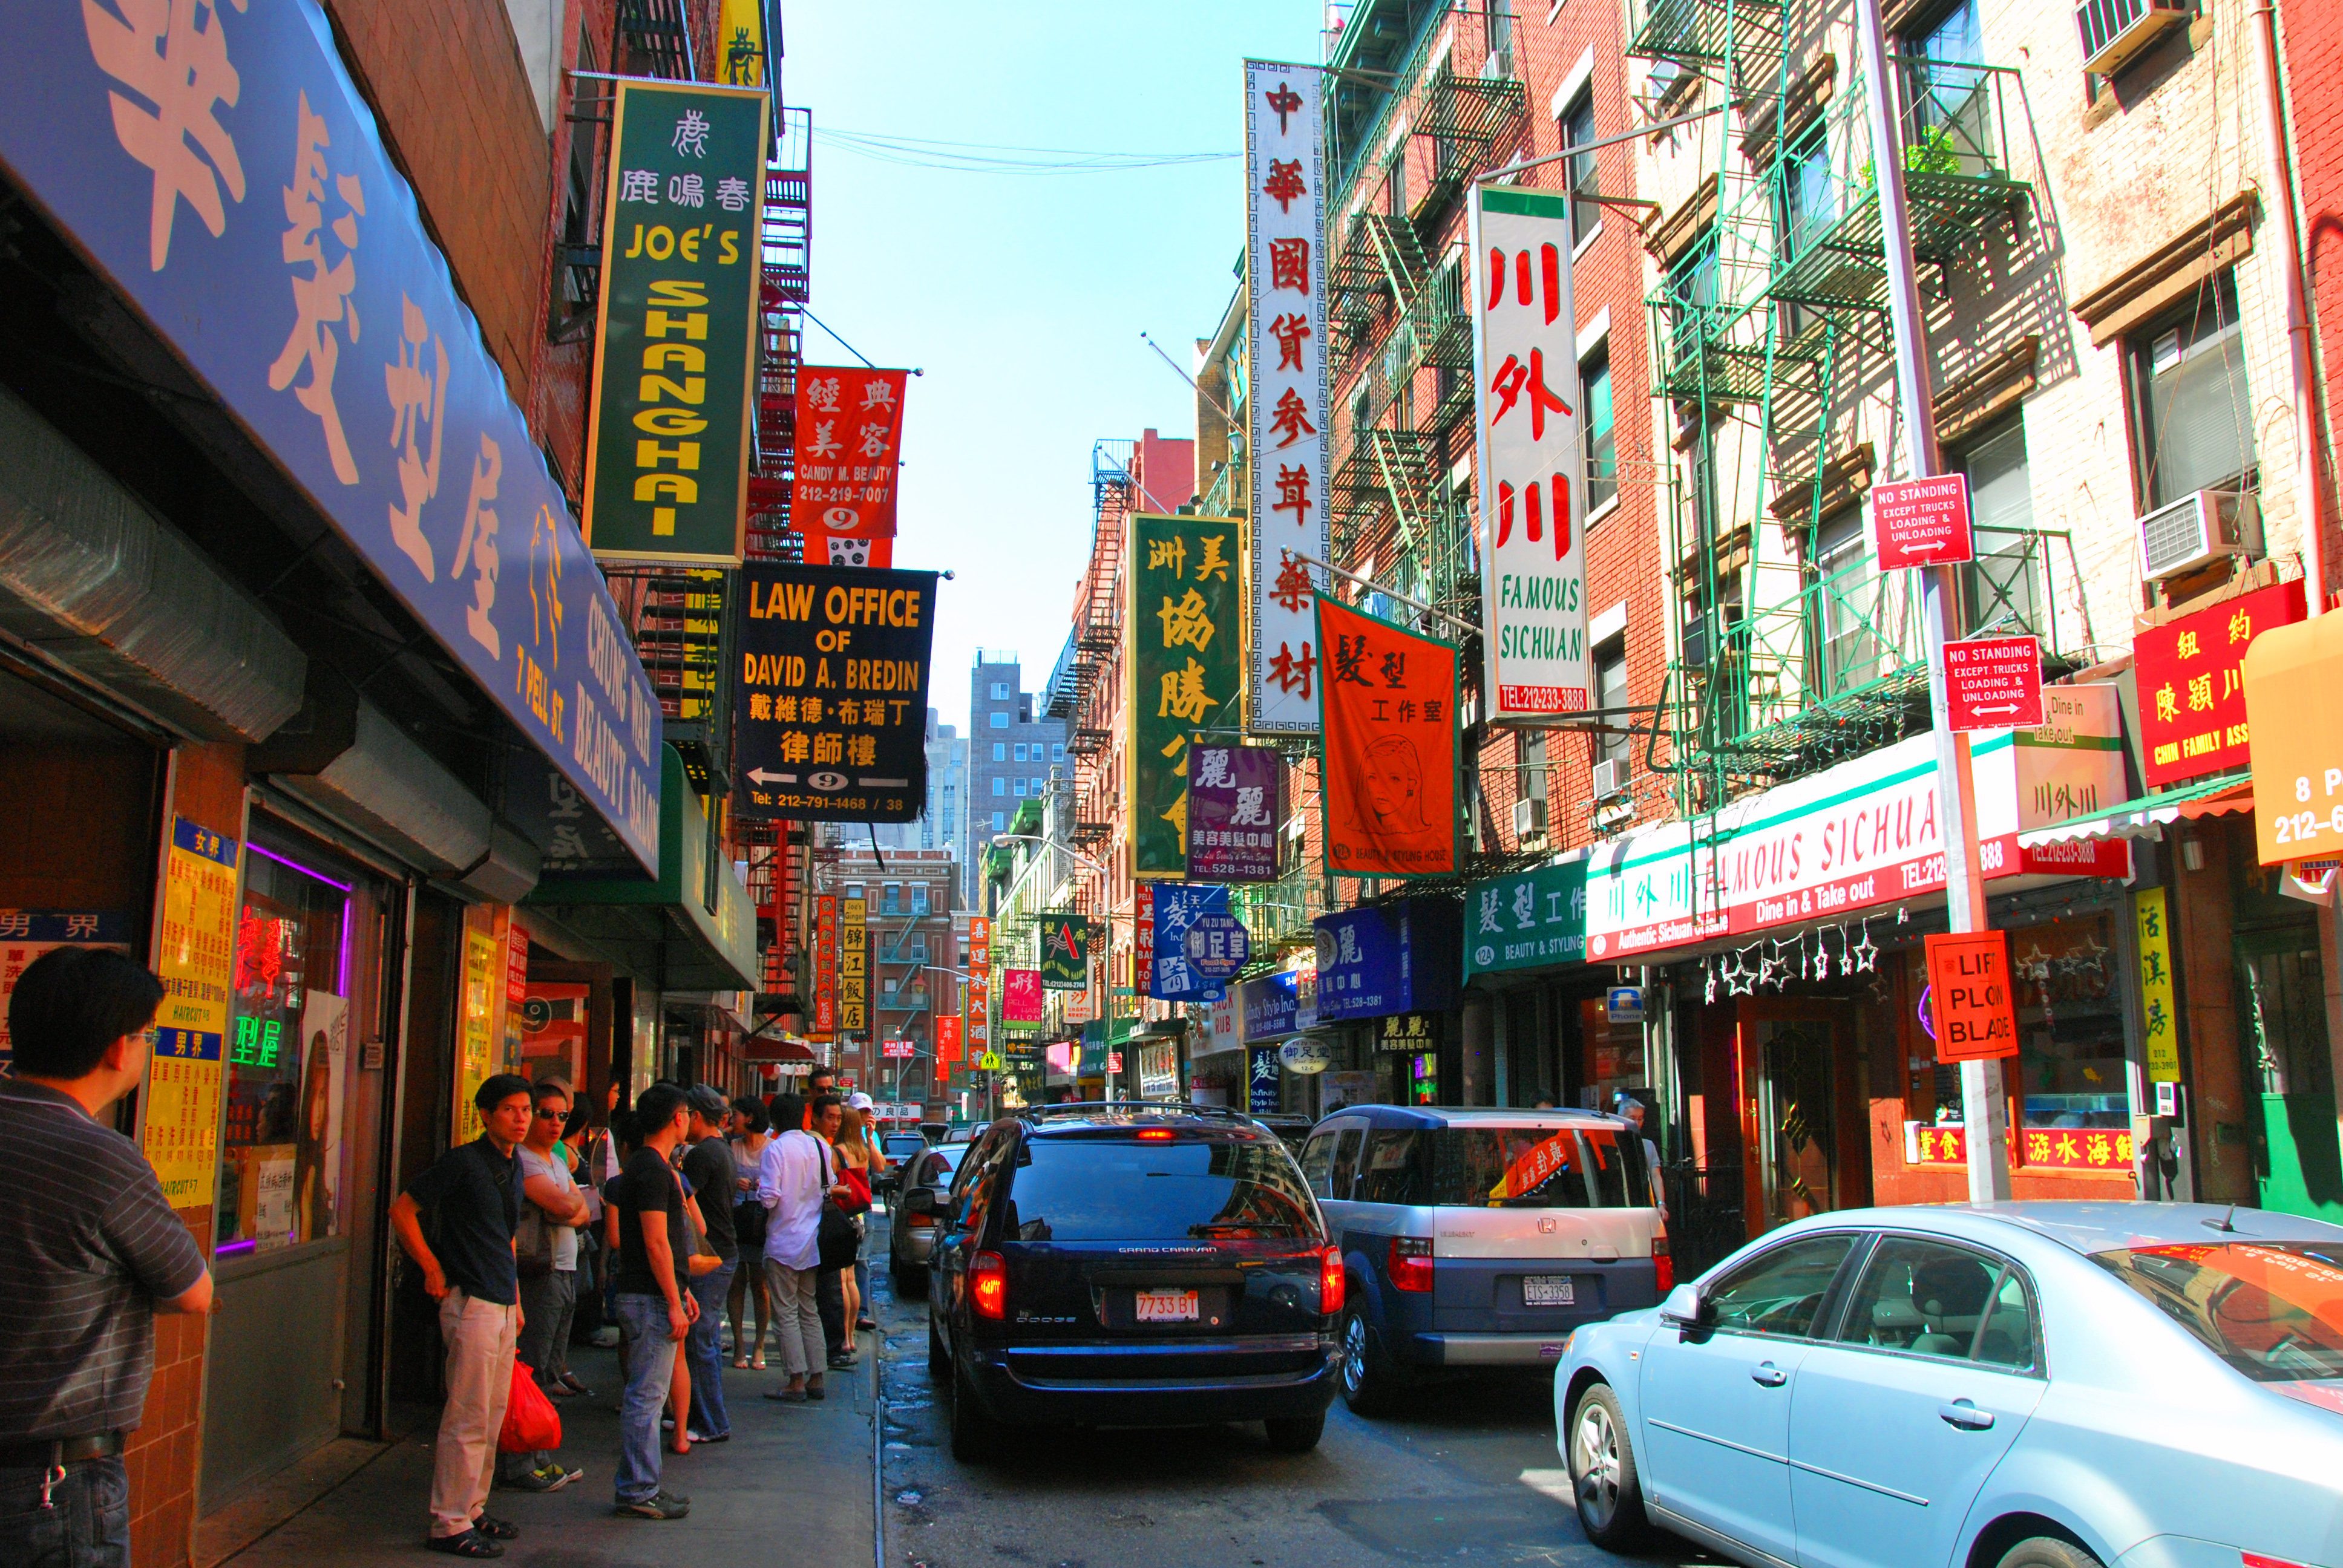
 Manhattan Chinatown
Manhattan's Chinatown is one of the largest Chinese communities outside of Asia. Within Manhattan's expanding Chinatown lies a "Little Fuzhou" on East Broadway and surrounding streets, occupied predominantly by immigrants from the Fujian Province of Mainland China. Areas surrounding the "Little Fuzhou" consist mostly of Cantonese immigrants from Guangdong Province, the earlier Chinese settlers, and in some areas moderately of Cantonese immigrants. In the past few years, however, the Cantonese dialect that has dominated Chinatown for decades is being rapidly swept aside by Mandarin, the national language of China and the lingua franca of most of the latest Chinese immigrants.[65] The energy and population of Manhattan's Chinatown are fueled by relentless, massive immigration from Mainland China, both legal and illegal in origin, propagated in large part by New York's high density, extensive mass transit system, and huge economic marketplace.
The early settlers of Manhattan's Chinatown were mostly from Taishan and Hong Kong of the Guangdong Province of China, which are the Cantonese speakers, and also from Shanghai.[66] They form most of the Chinese population of the area surrounded by Mott and Canal Streets.[66] The later settlers, from Fuzhou, Fujian, form the Chinese population of the area bounded by East Broadway.[66] Chinatown's modern borders are roughly Delancey/Kenmare Street on the north, Broadway on the west, Chamber Street on the east, and East Broadway to the south.[67] [66]
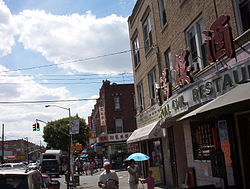
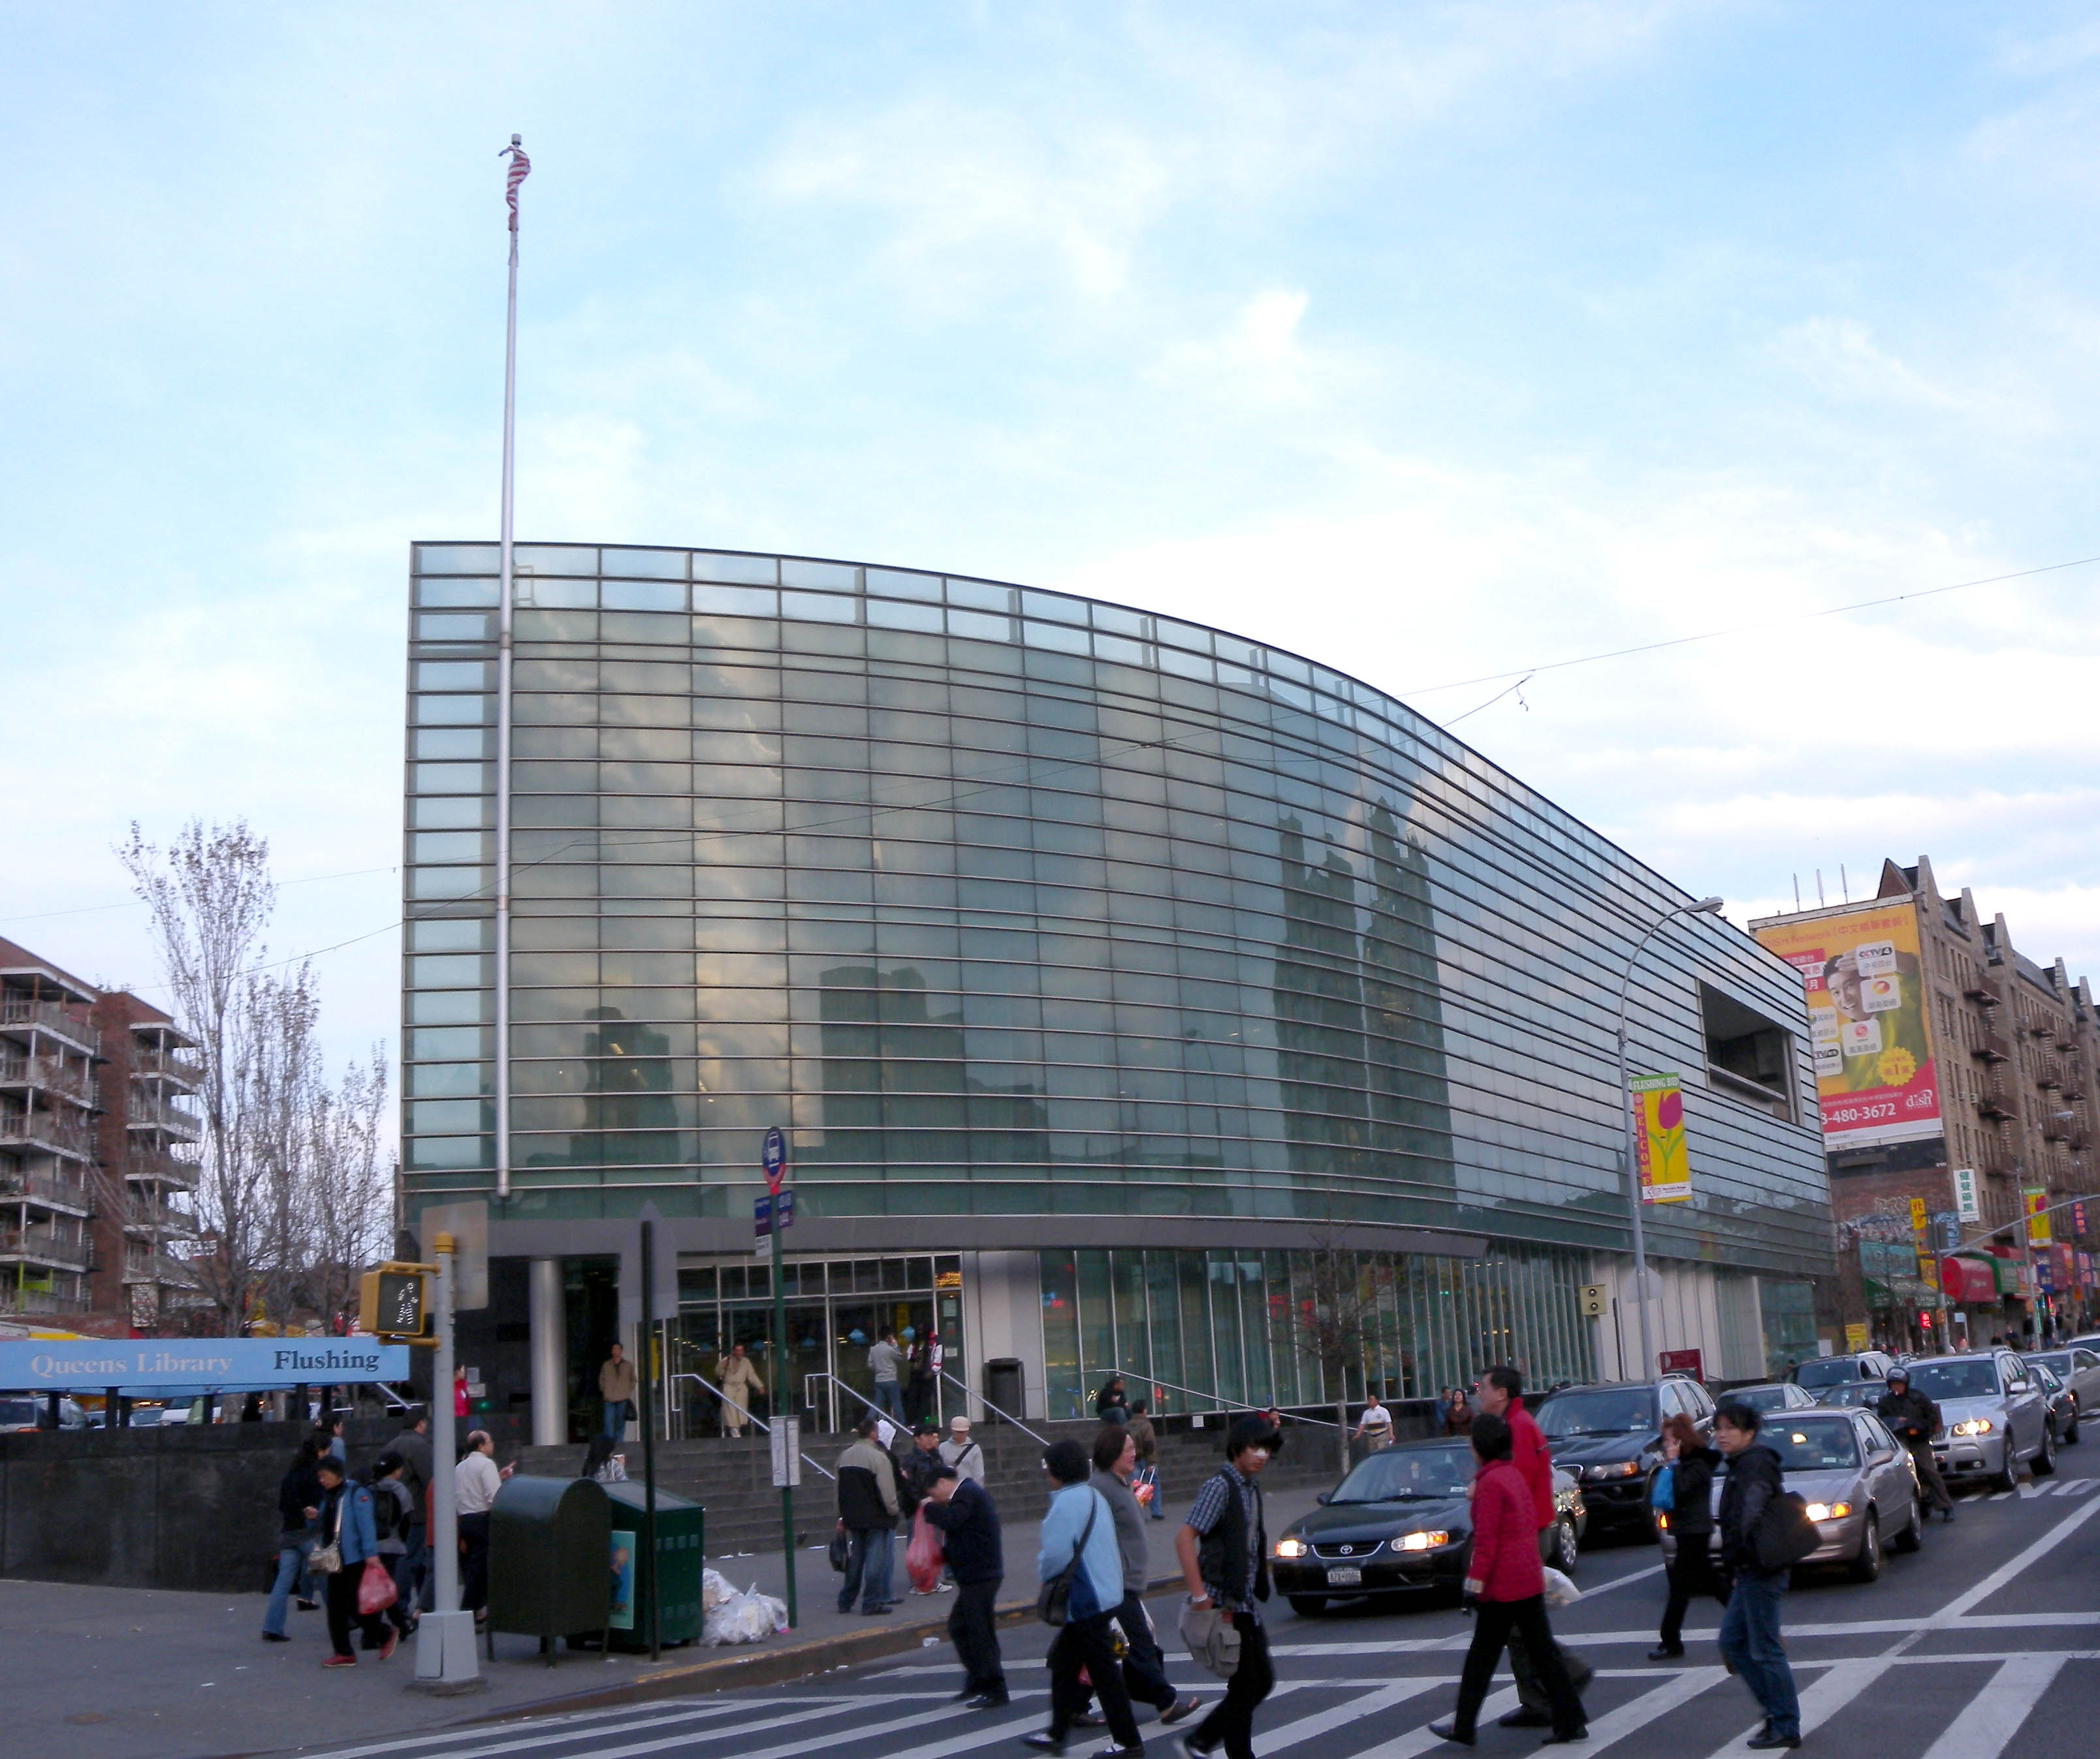
 Queens Library in Flushing Chinatown
The Flushing Chinatown, in the Flushing area of the borough of Queens in New York City, is one of the largest and fastest growing ethnic Chinese enclaves outside of Asia, as well as within New York City itself. Main Street and the area to its west, particularly along Roosevelt Avenue, have become the primary nexus of Flushing Chinatown. However, Chinatown continues to expand southeastward along Kissena Boulevard and northward beyond Northern Boulevard. In the 1970s, a Chinese community established a foothold in the neighborhood of Flushing, whose demographic constituency had been predominantly non-Hispanic white. Taiwanese began the surge of immigration, followed by other groups of Chinese. By 1990, Asians constituted 41% of the population of the core area of Flushing, with Chinese in turn representing 41% of the Asian population.[68] However, ethnic Chinese are constituting an increasingly dominant proportion of the Asian population as well as of the overall population in Flushing and its Chinatown. A 1986 estimate by the Flushing Chinese Business Association approximated 60,000 Chinese in Flushing alone.[69] Mandarin Chinese (including Northeastern Mandarin), Fuzhou dialect, Min Nan Fujianese, Wu Chinese, Beijing dialect, Wenzhounese, Shanghainese, Cantonese, Taiwanese, and English are all prevalently spoken in Flushing Chinatown. Even the relatively obscure Dongbei style of cuisine indigenous to Northeast China is now available in Flushing Chinatown.[70] Given its rapidly growing status, the Flushing Chinatown may surpass in size and population the original New York City Chinatown in the borough of Manhattan within a few years, and it is debatable whether this has already happened.
 Brooklyn Chinatown
By 1988, 90% of the storefronts on Eighth Avenue in Sunset Park, Brooklyn, were abandoned. Chinese immigrants then moved into this area, not only new arrivals from China, but also members of Manhattan's Chinatown, seeking refuges from high rents, who fled to the cheap property costs and rents of Sunset Park and formed the Brooklyn Chinatown,[71] which now extends for 20 blocks along 8th Avenue, from 42nd to 62nd Streets. This relatively new but rapidly growing Chinatown located in Sunset Park was originally settled by Cantonese immigrants like Manhattan's Chinatown in the past. However, in the recent decade, an influx of Fuzhou immigrants has been pouring into Brooklyn's Chinatown and supplanting the Cantonese at a significantly higher rate than in Manhattan's Chinatown, and Brooklyn's Chinatown is now home to mostly Fuzhou immigrants. In the past, during the 1980s and 1990s, the majority of newly arriving Fuzhou immigrants were settling within Manhattan's Chinatown, and the first Little Fuzhou community emerged in New York City within Manhattan's Chinatown; by the first decade of the 21st century, however, the epicenter of the massive Fuzhou influx had shifted to Brooklyn Chinatown, which is now home to the fastest growing and perhaps largest Fuzhou population in New York City. Unlike the Little Fuzhou in the Manhattan Chinatown, which remains surrounded by areas which continue to house significant populations of Cantonese, all of Brooklyn's Chinatown is swiftly consolidating into New York City's new Little Fuzhou. However, a growing community of Wenzhounese immigrants from China's Zhejiang Province is now also arriving in Brooklyn Chinatown.[72][73] Also in contrast to Manhattan's Chinatown, which still successfully continues to carry a large Cantonese population and retain the large Cantonese community established decades ago in the western section of Manhattan's Chinatown, where Cantonese residents have a communal gathering venue to shop, work, and socialize, Brooklyn Chinatown is very quickly losing its Cantonese community identity.[74]
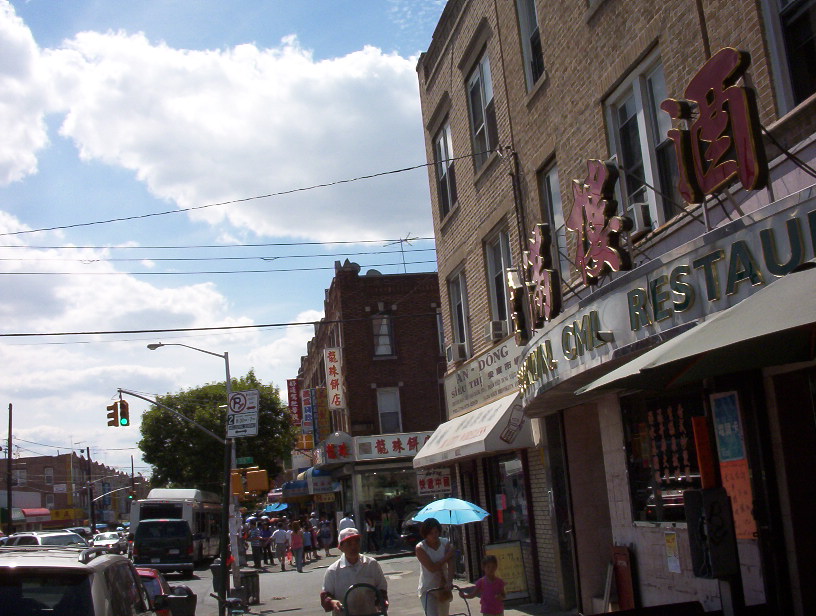
Elmhurst, another neighborhood in Queens, also has a large Chinese community.[75] Previously a small area with Chinese shops on Broadway between 81st Street and Cornish Avenue, this new Chinatown in Elmhurst, Queens has now expanded to 45th Avenue and Whitney Avenue.
Avenue U in Homecrest, Brooklyn supports New York City's newest Chinatown, as evidenced by the growing number of Chinese-run fruit markets, restaurants, beauty and nail salons, and computer and general electronics dealers.
Filipino
New York City is home to about 68,000 Filipinos. Immigration from the Philippines began mainly after 1965, when immigration quotas that prevented Filipino immigration for many years were abolished. While there was earlier immigration from the Philippines, it was in low numbers and mainly concentrated in Hawaii and California. Since then, Filipinos have settled in Northeastern cities, mainly in New York City. Most of these immigrants have been professionals (doctors, nurses, other medical professions, accountants and engineers).
New York City annually hosts the Philippine Independence Day Parade, which is traditionally held on the first Sunday of June at Madison Avenue. The celebration occupies nearly twenty-seven city blocks which includes a 3.5-hour parade and an all-day long street fair and cultural performances.
A "Little Manila" can be found in Woodside, in the borough of Queens.
Filipinos are also concentrated in Jackson Heights and Elmhurst. There are also smaller Filipino communities in Jamaica and parts of Brooklyn. The Benigno Aquino triangle is located in Hillside Avenue of Hollis to commemorate the large Filipino American population in the area.[76]
Although not technically part of New York City, other large Filipino populations just outside of the City's borders can be found in neighboring Northeastern New Jersey, particularly in Bergen, Hudson, and Passaic Counties.
Queens Village is seeing a growing Filipino population.
South Asian
Further information: Indian American and Pakistani AmericanAccording to 2007 American Community Survey estimates, New York City is home to approximately 315,000 people from the Indian subcontinent, which includes the countries of India (236,117), Pakistan (39,002), Bangladesh (34,332), and Sri Lanka (5,010). South Asians constitute 3.8% of New York City's population.[77] A majority of the South Asian residents are concentrated in Queens neighborhoods such as Jackson Heights, Flushing, Glen Oaks, Kew Gardens, and Elmhurst. In the borough of Queens, the South Asian population is approximately 186,000, where they constitute 8.2% of the population. South Asians from the Caribbean majority from Guyana, Trinidad, and a small number from Jamaica are also large in number.
Eastern Mediterranean
Arab
 A Syrian man selling cold drinks in Lower Manhattan, circa 1908
Arabs first immigrated to New York city in the 1880s, the vast majority of them came from modern day Syria and Lebanon. From 1880 to 1960 the overwhelming majority (90%) of Lebanese and Syrians were of the Christian faith.[78] After 1960, especially after the Immigration and Nationality Act of 1965, Arab Muslims from other Arab countries and territories like Palestine, Jordan, and Egypt started arriving in New York. The Syrian/Lebanese mother colony was located around Washington street in Lower Manhattan.[79] After the construction of the Brooklyn battery tunnel, a large percentage of the community moved to the area around downtown Brooklyn; and set up shops and businesses on Atlantic Avenue. Two long time established businesses on Atlantic Avenue are still there. Damascus Bakery is still in business since 1936, and Sahadi's has had a strong loyal customer base since 1948. By the 1960s the community was to move yet again this time to Park Slope and Bay Ridge.[80]
The New York metro area contains the largest concentration of populations with Arab and Middle Eastern ancestry in the U.S., with 230,899 residents of the metro area claiming Arab ancestry in the 2000 U.S. Census.[81] An estimated 70,000 lived in New York City proper as of 2000.[82][83] New York City holds the New York Arab-American Comedy Festival , founded in 2003 by comedian Dean Obeidallah and comedienne Maysoon Zayid.
Jewish
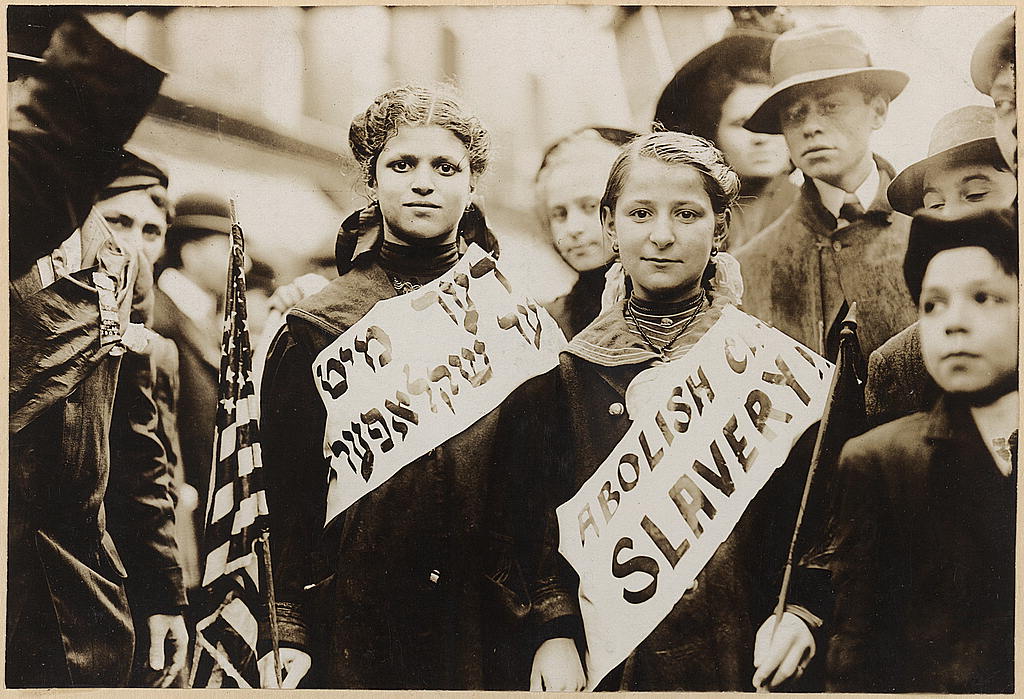
Further information: American Jews Two girls wearing banners with the slogan "ABOLISH CHILD SLAVERY!!" in English and Yiddish. Probably taken during the May 1st, 1909 New York labor parade.
The New York metropolitan area is home to the largest Jewish population in the world outside Israel. The New York metropolitan area's Jewish population in 2001 was approximately 1.97 million, 600,000 fewer than in Israel's largest metropolitan area, denoted as Gush Dan. In 2002, an estimated 972,000 Ashkenazic Jews lived in New York City and constituted about 12% of the city's population. New York City is also home to the world headquarters of the Hasidic Chabad-Lubavitch group and the Bobover, Pupa, [[Viznitz]and Satmar branches of Hasidism, ultra-Orthodox sects of Judaism.[citation needed]
The Jewish presence in New York City dates to the 17th century, when a Jewish community relocated from Recife in Brazil, seeking freedom of worship. Major immigration of Jews to New York began in the 1880s, with the increase of antisemitic actions in Central and Eastern Europe. The number of Jews in New York City soared throughout the beginning of the 20th century and reached a peak of 2 million in the 1950s, when Jews constituted one-quarter of the city's population. New York City's Jewish population then began to decline because of low fertility rates and migration to suburbs and other states, particularly California and Florida. A new wave of Ashkenazi, Bukharian, and Georgian Jewish immigrants from the former Soviet Union began arriving in the 1980s and 1990s. Sephardic Jews including Syrian and other Jews of non-European origin have also lived in New York City since the 17th century. Many Jews, including the newer immigrants, have settled in Queens, south Brooklyn, and the Bronx, where at present most live in middle-class neighborhoods such as Riverdale.[citation needed]
19th-century Jewish immigrants settled mainly in the tenement houses of the Lower East Side of Manhattan. Today New York City's Jewish population is dispersed among all the boroughs; Brooklyn's Jewish population in 2003 was estimated as 456,000, and Manhattan's as 243,000.
While three-quarters of New York Jews do not consider themselves religiously observant, the Orthodox community is rapidly growing due to the high birthrates of Hasidic sects, while the numbers of Conservative and Reform Jews are declining.[citation needed]
Like the Irish, the Jewish community has played an important role in New York City's politics; Jewish voters traditionally vote in large numbers and have often supported politically liberal policies.
European
German
Further information: German AmericanCarl Schurz, a refugee from the unsuccessful first German democratic revolution of 1848, served as United States Secretary of the Interior and as United States Senator from Missouri. Carl Schurz Park in Manhattan is named after him.
The influence of German immigration can still be felt in areas of New York City. The Yorkville neighborhood on the Upper East Side of Manhattan was a center of German-American culture. As of the 2000 census 255,536 New Yorkers reported German ancestry.[84]
In the middle of the 19th century, Little Germany, in what is now termed Alphabet City, was the first non-English-speaking urban enclave in the United States.
Greeks
Greek immigration to New York City began mainly in the 1890s. The push factors for immigration were hardship under Ottoman rule, the Balkan Wars and World War I. Greek immigration to New York City took place between 1890 until around 1917. In the latter years more women arrived and communities began to grow, especially in Astoria, Queens. Greeks again began to arrive in large numbers after 1945, as they fled the economic devastation caused by World War II and the Greek Civil War.
In the first immigration wave, most of the Greek immigrants were men. Many of them worked in industrial labor jobs and others created a niche in the fur business. This immigration wave brought 450,000 Greeks to the Northeast, largely concentrated in New York City. The second immigration wave taking place after 1945 and 1982, was smaller with a total of 211,000 immigrants, mostly within the Northeast. However, new immigrants helped revive assimilating Greek communities and added new energy to a sense of ethnic identity.
The largest concentration of Greeks can still be found in Astoria. The Greek community there was established in the early 20th century immigration. The neighborhood still has many Greek food stores and restaurants. Residents of Greek descent make up 1.0% of New York City's population.
Irish
Further information: Irish Americans in New York CityThe Irish community is one of New York's major ethnic groups and has been a significant proportion of the City's population since the waves of immigration in the mid-19th century. New York City's St. Patrick's Day Parade dates to 1762.
During the Great Irish Famine (1845–1851), Irish families were forced to emigrate from the country. By 1854, between 1.5 and 2 million people left Ireland - about a quarter of the pre-famine population. In the United States, most of the recently-arrived Irish became city dwellers as that was where work was. In addition, arriving with little money, many settled in the cities at which their ships made port. By 1850, the Irish made up a quarter of the population in Boston, New York City, Philadelphia, and Baltimore. Their arrival in the United States before other waves of Catholic immigrants meant that ethnic Irish long dominated the Roman Catholic Church in America. They created a strong network of churches and parochial schools to support their communities.
The Irish have long played a significant role in city politics, the Roman Catholic Church, and the New York City Fire Department and Police Department. As of the 2000 census, 420,810 New Yorkers reported Irish ancestry.[85]
According to a 2006 genetic survey by Trinity College in Dublin, Ireland, about one in 50 New Yorkers of European origin carry a distinctive genetic signature on their Y chromosomes inherited from Niall of the Nine Hostages, an Irish high king of the 5th century A.D.[86]
- Woodlawn, Bronx
- Woodside, Queens
- Maspeth, Queens
- Sunnyside, Queens
- North Riverdale, Bronx
- Riverdale, Bronx
- Bay Ridge, Brooklyn
- Marine Park, Brooklyn
- Gerritsen Beach, Brooklyn
- Vinegar Hill, Brooklyn
- Belle Harbor, Queens
- Breezy Point, Queens
- Rockaway Beach, Queens
- Roxbury, Queens
- St. George, Staten Island
- Middle Village, Queens, New York
Italian
Further information: Italian-American
New York City has a large population of Italian Americans, many of whom inhabit ethnic enclaves in Brooklyn, the Bronx, Queens, and Staten Island.
The largest wave of Italian immigration to the United States took place in the late 19th century and early 20th century. Between 1820 and 1978, 5.3 million Italians immigrated to the United States, including over two million between 1900 and 1910. Only the Irish and Germans immigrated in larger numbers. Italian families first settled in Little Italy's neighborhoods, the first and most famous one being the one around Mulberry Street, in Manhattan. This settlement, however, is rapidly becoming part of the adjacent Chinatown as the older Italian residents die and their children move elsewhere. As of the 2000 census, 692,739 New Yorkers reported Italian ancestry, making them the largest European ethnic group in the city.[87] New York metropolitan area is home to 3,372,512 Italians, which is among the largest concentration in the world after Sao Paulo, Buenos Aires, Milan and Rome metropolitan areas.
- Arthur Avenue (Bronx), New York
- Bensonhurst, Brooklyn, New York
- Morris Park, Bronx, New York
- Cobble Hill, Brooklyn, New York
- Carroll Gardens, Brooklyn, New York
- Mulberry Street, Manhattan (New York's Little Italy)
- Pleasant Avenue, East Harlem, Manhattan, New York
- Howard Beach, Queens, New York
- Staten Island, New York
- Mill Basin, Brooklyn, New York
- Whitestone, Queens, New York
- Ozone Park, Queens, New York
- Bergen Beach, Brooklyn, New York
Polish
Further information: Polish AmericanPolish immigration to New York City began at the end of the 19th century. In the 1980s, as a result of the Polish government's crackdown on the burgeoning Solidarnosc labor and political movement, Polish migration to the U.S. swelled. Polish-Americans and Polish immigrants in the city generally reside in Brooklyn (Greenpoint and Williamsburg) *Ridgewood, Queens, & *Maspeth, Queens . The combined neighborhood of Greenpoint/Williamsburg is sometimes referred to as "Little Poland" because of its large population of primarily working-class Polish immigrants, reportedly the second largest concentration in the United States, after Chicago. As of the 2000 census, 213,447 New Yorkers reported Polish ancestry.[88]
New York is home to a number of Polish and Polish-American cultural, community, and scientific institutions, including the Polish Institute of Arts and Sciences of America (PIASA) and the Polish Cultural Institute. Polish-language publications with circulation reaching outside the city include The Polish Review, an English-language scholarly journal published since 1956 by PIASA; Nowy Dziennik [3], founded in 1971, considered the leading Polish-language daily newspaper in the U.S.; and Polska Gazeta [4], a Polish-language daily newspaper with headquarters in Brooklyn. The Polish Newspaper SuperExpress [5], covering New York, New Jersey & Connecticut started publication in 1996.
The Pulaski Day Parade in New York on Fifth Avenue has been celebrated since 1937 to commemorate Kazimierz Pułaski, a Polish hero of the American Revolutionary War. It closely coincides with the October 11 General Pulaski Memorial Day, a national observance of his death at the Siege of Savannah, and his held on the first Sunday of October. In these parades march Polish dancers, Polish soccer teams and their mascots, Polish Scouts - ZHP and Polish school ambassadors and representatives, such as Mikolaj Pastorino (Nicholas Pastorino) and Lech Wałęsa. The Pulaski Day Parade is one of the largest parades in New York City.
Romanian
Further information: Romanian AmericanThe Romanian community of New York City is the largest such community in North America. The 2000 Census reported 161,900 Romanians were living in New York City. They are mainly concentrated in The Bronx, as well as in parts of Manhattan and Staten Island. The Romanian Day Festival, for which the City closes a section of Broadway, demonstrates the strong sense of community of Romanians living in New York.
Russian
Further information: Russian AmericanNew York City contains a very large, and growing Russian-Jews population around 300,000. There are large numbers of Russian-Jews in Brooklyn, mostly in neighborhoods of Southern Brooklyn most famously Brighton Beach "Little Odessa" where there are a lot of business and billboards with signage entirely in the Russian language.
Ukrainian
Further information: Ukrainian AmericanNew York City contains a large and growing Ukrainian population. New York's Ukrainian population was traditionally centered around the East Village in Manhattan, as well as Little Odessa, also known as Brighton Beach, in Brooklyn. Urban flight and recent waves of new immigration have spread Ukrainians throughout the boroughs, with a heavy concentration in Brooklyn.
Muslims
In 1907, Lipka Tatar immigrants from the Podlasie region of Poland founded the first Muslim organization in New York City, the American Mohammedan Society.[89]
In recent times, the Muslim population has grown rapidly: before 1970 there were fewer than ten mosques in New York City; as of 2001, there were well over a hundred.[90] Today, Muslims number an estimated 600,000 and are one of the fastest growing religious communities in the city.[91]
Hispanic
Puerto Rican
Further information: Puerto Rican migration to New York The 2005 National Puerto Rican Parade.
New York City has the largest Puerto Rican population outside of Puerto Rico. Puerto Ricans, because of the changing citizenship status of the island's residents, can technically be said to have come to the City first as immigrants and subsequently as migrants. The first group of Puerto Ricans moved to New York in the mid-19th century, when Puerto Rico was a Spanish colony and its people Spanish subjects. The following wave of Puerto Ricans to move to New York did so after the Spanish-American War of 1898 made Puerto Rico a U.S. possession and after the Jones-Shafroth Act of 1917 gave Puerto Ricans U.S. citizenship, which allows travel without the need of a passport between the island and the United States mainland. The largest wave of migration came in the 1950s, in what became known as "The Great Migration"; as a result, more than a million Puerto Ricans once called New York City home. Presently the Puerto Rican population is around 800,000.
Puerto Ricans have historically lived in neighborhoods such as the Lower East Side (also known in the community as Loisaida), Spanish Harlem and Williamsburg, Brooklyn since the 1950s.
Dominican
Further information: Dominican AmericanImmigration records of Dominicans in the United States date from the late 19th century, and New York City has had a Dominican community since the 1930s. From the 1960s onward, after the fall of the Rafael Trujillo military regime, large waves of migration have thoroughly transnationalized the Dominican Republic, metaphorically blurring its frontier with the United States.
In 2006 New York City's Dominican population decreased for the first time since the 1980s, dropping by 1.3% from 609,885 in 2006 to 602,093 in 2007. They are the city's second-largest national group and, in 2009, it was estimated that they compromised 24.9% of New York City's Latino population.[92]
Areas with high a concentration of Dominicans are in Washington Heights, Corona, and certain areas in the Bronx. Certain areas seeing an increasing number of Dominicans are in Bushwick, Brooklyn and Ridgewood, Queens.
Mexican
At the 2010 Census, there were 319,263 Mexican Americans living in New York City.[93] In 2009, it was estimated that of the city's Hispanic population, 13.5% was of Mexican origin. [92] Mexicans are the fastest growing group of Hispanic population. Some estimates suggest that Mexicans will surpass both Puerto Ricans and Dominicans in 2023 to become the city’s largest national Latino sub-group, and that Dominicans will surpass Puerto Ricans in 2030 to become the second largest Latino nationality.[92]
Ecuadorian
In 2009, it was estimated that 211,378 Ecuadorian Americans lived in New York City, representing 8.9% of the city's Hispanic population. They are the fourth largest sub-group of Hispanics, after Puerto Ricans, Dominicans and Mexicans. [92]
Colombian
Colombians have come in small numbers to New York City since the 1960s. The major exodus of Colombians from Colombia came in the early 1980s when many of Colombias cities were facing hardships from drug traffickers, crime and lack of emplyoment. 75% of Colombians in New York City live in Queens, specifically in Jackson Heights, Corona, Elmhurst and Murray Hill.[citation needed]
See also
- Demographics of The Bronx
- Demographics of Brooklyn
- Demographics of Manhattan
- Demographics of Queens
- Demographics of Staten Island
- Crime in New York City
- Illegal immigration in New York City
References
- ^ "Yearbook of Immigration Statistics: 2009 - Supplemental Table 2". http://www.dhs.gov/files/statistics/publications/LPR09.shtm. Retrieved 2010-04-30.
- ^ Roberts, Sam (April 28, 2010). "Listening to (and Saving) the World's Languages". The New York Times. http://www.nytimes.com/2010/04/29/nyregion/29lost.html?hpw. Retrieved 2011-10-31.
- ^ a b c d U.S. Census Bureau press release, "U.S. Census Bureau Delivers New York's 2010 Census Population Totals, ...", March 24, 2011, and this accompanying Microsoft Excel spreadsheet, Table 1. The Most Populous Counties and Incorporated Places in 2010 in New York: 2000 and 2010, which cites "U.S. Census Bureau, Census 2000 Redistricting Data (Public Law 94-171) Summary File, Table PL1, and ... Table P1.", retrieved on April 2, 2011
- ^ County and City Data Book:2007 (U.S. Census Bureau), Table B-1, Area and Population, retrieved on July 12, 2008. New York County (Manhattan) was the nation's densest-populated county, followed by Kings County (Brooklyn), Bronx County, Queens County and San Francisco, California.
- ^ American Fact Finder (U.S. Census Bureau): New York by County - Table GCT-PH1. Population, Housing Units, Area, and Density: 2000 Data Set: Census 2000 Summary File 1 (SF 1) 100-Percent Data, retrieved on February 6, 2009
- ^ Greene and Harrington (1932). American Population Before the Federal Census of 1790. New York., as cited in: Rosenwaike, Ira (1972). Population History of New York City. Syracuse, N.Y.: Syracuse University Press. p. 8. ISBN 0815621558.
- ^ a b Gibson, Campbell.Population of the 100 Largest Cities and Other Urban Places in the United States:1790 to 1990, United States Census Bureau, June 1998. Retrieved June 12, 2007.
- ^ United States -- Places and (in selected states) County Subdivisions with 50,000 or More Population; and for Puerto Rico, United States Census Bureau United States Census, 2000. Accessed June 12, 2007.
- ^ "Population Density", Geographic Information Systems - GIS of Interest. Accessed May 17, 2007. "What I discovered is that out of the 3140 counties listed in the Census population data only 178 counties were calculated to have a population density over one person per acre. Not surprisingly, New York County (which contains Manhattan) had the highest population density with a calculated 104.218 persons per acre."
- ^ a b c "Census 2000 Data for the State of New York". U.S. Census Bureau. http://www.census.gov/census2000/states/ny.html. Retrieved 2006-07-19.
- ^ a b New York City Department of City Planning (2005). "The Newest New Yorkers: 2000" (PDF). http://www.nyc.gov/html/dcp/pdf/census/nny_briefing_booklet.pdf. Retrieved 2007-03-27.
- ^ "Appendix Table 5-4: Ten Largest Sources of the Foreign-Born by County New York Metropolitan Region, 2000" (PDF). New York City Department of City Planning. 2005. http://home2.nyc.gov/html/dcp/pdf/census/nny_table_5_4.pdf. Retrieved 2007-03-26.
- ^ "World Jewish Population". SimpleToRemember.com – Judaism Online. http://www.simpletoremember.com/vitals/world-jewish-population.htm. Retrieved May 12, 2011.
- ^ "New York-Newark-Bridgeport, NY-NJ-CT-PA CSA ACS Demographic and Housing Estimates: 2009". U.S. Census Bureau. http://factfinder.census.gov/servlet/ADPTable?_bm=y&-geo_id=33000US408&-qr_name=ACS_2009_1YR_G00_DP5&-context=adp&-ds_name=&-tree_id=309&-_lang=en&-redoLog=false&-format=. Retrieved May 12, 2011.
- ^ "United States ACS Demographic and Housing Estimates: 2009". U.S. Census Bureau. http://factfinder.census.gov/servlet/ADPTable?_bm=y&-geo_id=01000US&-qr_name=ACS_2009_1YR_G00_DP5&-context=adp&-ds_name=&-tree_id=5309&-_lang=en&-redoLog=false&-format=. Retrieved May 12, 2011.
- ^ Kirk Semple (2011-06-23). "Asian New Yorkers Seek Power to Match Numbers". The New York Times Company. http://www.nytimes.com/2011/06/24/nyregion/asian-new-yorkers-asian-new-yorkers-seek-power-to-match-surging-numbers.html?scp=1&sq=asians&st=cse. Retrieved 2011-07-05.
- ^ "New York-Newark-Bridgeport, NY-NJ-CT-PA Combined Statistical Area ACS Demographic and Housing Estimates: 2008". http://factfinder.census.gov/servlet/ADPTable?_bm=y&-geo_id=33000US408&-qr_name=ACS_2008_1YR_G00_DP5&-context=adp&-ds_name=&-tree_id=308&-_lang=en&-redoLog=false&-format=. Retrieved April 17, 2010.
- ^ Kirk Semple (2011-06-23). "Asian New Yorkers Seek Power to Match Numbers". The New York Times Company. http://www.nytimes.com/2011/06/24/nyregion/asian-new-yorkers-asian-new-yorkers-seek-power-to-match-surging-numbers.html?scp=1&sq=asians&st=cse. Retrieved 2011-07-05. "Asians, a group more commonly associated with the West Coast, are surging in New York, where they have long been eclipsed in the city’s kaleidoscopic racial and ethnic mix. For the first time, according to census figures released in the spring, their numbers have topped one million — nearly 1 in 8 New Yorkers — which is more than the Asian population in the cities of San Francisco and Los Angeles combined."
- ^ "Asian American Statistics". © 2011 Améredia Incorporated. http://www.ameredia.com/resources/demographics/asian_american.html. Retrieved 2011-07-05.
- ^ "Table SF1-P9 NYC: Total Asian Population by Selected Subgroups". NYC.gov. http://www.nyc.gov/html/dcp/pdf/census/census2010/t_sf1_p9_nyc.pdf. Retrieved 2011-08-27.
- ^ "NYC2005 — Results from the 2005 American Community Survey: Socioeconomic Characteristics by Race/Hispanic Origin and Ancestry Group" (PDF). New York City Department of City Planning. 2005. http://www.nyc.gov/html/dcp/pdf/census/acs_socio_05_nyc.pdf. Retrieved 2007-08-14.
- ^ [http://www.nyc.gov/html/dcp/html/census/popacs.shtml Population Division American Community Survey — New York City Department of City Planning
- ^ Archive of the Mayor's Press Office, Mayor Giuliani Proclaims Puerto Rican Week in New York City, Tuesday, June 9, 1998.
- ^ Roberts, Sam (April 9, 2005). "In Manhattan, Poor Make 2 Cents for Each Dollar to the Rich". The New York Times. http://www.fiscalpolicy.org/SamRoberts4Sep05.htm. Retrieved 2007-03-27.
- ^ a b c "Average Weekly Wage in Manhattan at $1,453 in Second Quarter 2006" (PDF). Bureau of Labor Statistics, U.S. Department of Labor. February 20, 2007. http://www.bls.gov/ro2/fax/qcew9310.pdf. Retrieved 2007-02-21.
- ^ Roberts, Sam (2007-03-27). "In Surge in Manhattan Toddlers, Rich White Families Lead Way". The New York Times. http://www.nytimes.com/2007/03/23/nyregion/23kid.html. Retrieved 2007-03-27.
- ^ U.S. Census Bureau, Statistical Abstract of the United States, 2003 (page 617), Table 957: Housing Units and Tenure for Large Cities: 2000
- ^ Housing Vacancy Survey
- ^ List of U.S. states by population
- ^ a b U.S. Census Bureau, Population Division, Table 5. Annual Estimates of the Resident Population for Minor Civil Divisions in New York, Listed Alphabetically Within County: April 1, 2000 to July 1, 2009 (SUB-EST2009-05-36) and Table 1. Annual Estimates of the Resident Population for Incorporated Places Over 100,000, Ranked by July 1, 2009 Population: April 1, 2000 to July 1, 2009 (SUB-EST2009-01), Release Date: June 2010, retrieved on July 31, 2010
- ^ New York City Department of City Planning (December 2006). "New York City Population Projections by Age/Sex and Borough, 2000-2030" (PDF). http://www.nyc.gov/html/dcp/pdf/census/projections_report.pdf. Retrieved 2007-03-27. See also Roberts, Sam (2006-02-19). "By 2025, Planners See a Million New Stories in the Crowded City". New York Times. http://www.nytimes.com/2006/02/19/nyregion/19population.html?ex=1298005200&en=c586d38abbd16541&ei=5090&partner=rssuserland&emc=rss. Retrieved 2006-07-19.
- ^ New York City Department of Health and Mental Hygiene (2003-04-21). "Summary of Vital Statistics" (PDF). http://home2.nyc.gov/html/doh/downloads/pdf/vs/2001sum.pdf. Retrieved 2007-04-21.
- ^ For cities with more than 200,000 residents."G.I.S. Lounge U.S. Population Density, 2000 Census". GiS Lounge. http://gislounge.com/features/aa041101c.shtml. Retrieved 2006-01-29.
- ^ Harris Interactive (2005-09-11). "California and New York City Most Popular Places People would choose to Live". http://www.harrisinteractive.com/harris_poll/index.asp?PID=697. Retrieved 2007-03-02.
- ^ New York City Department of City Planning (2005). "Appendix Table 5-4: Ten Largest Sources of the Foreign-Born by County New York Metropolitan Region, 2000" (PDF). http://home2.nyc.gov/html/dcp/pdf/census/nny_table_5_4.pdf. Retrieved 2007-03-26.
- ^ New York State Office of the State Comptroller (06-2006). "Queens: Economic Development and the State of the Borough Economy" (PDF). http://www.osc.state.ny.us/osdc/rpt3-2007queens.pdf. Retrieved 2007-03-21.
- ^ New York City Department of City Planning (2000). "2000 Census" (PDF). http://www.nyc.gov/html/dcp/pdf/census/mpsf3sb4.pdf. Retrieved 2007-05-24.
- ^ The New York Observer: Beveridge Fizzy On Future
- ^ 2006 American Community Survey: New York City
- ^ American Community Survey 2007-2009
- ^ Center for Latin American, Caribbean & Latino Studies
- ^ http://factfinder.census.gov/servlet/ADPTable?_bm=y&-geo_id=16000US3651000&-qr_name=ACS_2008_3YR_G00_DP3YR5&-context=adp&-ds_name=&-tree_id=308&-_lang=en&-redoLog=false&-format=
- ^ a b American Community Survey 2007-2009
- ^ "Claritas Study Ranks Racial/Ethnic Diversity in Counties Nationwide; Analysis Shows California Leads Nation In Diversity Among Counties Of 100,000-Plus Population". Business Wire. 2001-07-23. http://findarticles.com/p/articles/mi_m0EIN/is_2001_July_23/ai_76689304.
- ^ Roberts, Sam (2006-01-10). "Black Incomes Surpass Whites in Queens". The New York Times. http://www.nytimes.com/2006/10/01/nyregion/01census.html?ref=nyregion. Retrieved 2007-03-28.
- ^ O'Donnell, Michelle (2006-07-04). "In Queens, It's the Glorious 4th, and 6th, and 16th, and 25th..". New York Times. http://www.nytimes.com/2006/07/04/nyregion/04fourth.html. Retrieved 2006-07-19.
- ^ United Jewish Appeal-Federation of New York (2002). "Jewish Community Study of New York" (PDF). http://www.ujafedny.org/atf/cf/%7BAD848866-09C4-482C-9277-51A5D9CD6246%7D/JCommStudyIntro.pdf. Retrieved 2007-03-26.
- ^ Asian American Federation of New York (2004). "Census Profile:New York City's Indian American Population" (PDF). http://www.aafny.org/cic/briefs/indianamer.pdf. Retrieved 2007-03-28.
- ^ New York City Department of City Planning (2005). "The Newest New Yorkers: 2000" (PDF). http://www.nyc.gov/html/dcp/pdf/census/nny_table_5_3.pdf. Retrieved 2007-05-05.
- ^ "U.S. Census Bureau Census 2000". http://factfinder.census.gov/servlet/GCTTable?_bm=y&-geo_id=04000US36&-ds_name=DEC_2000_SF1_U&-_lang=en&-redoLog=false&-format=ST-2&-mt_name=DEC_2000_SF1_U_GCTP6_ST2&-CONTEXT=gct. Retrieved 2010-03-21.
- ^ "The Association of Religion Data Archives (ARDA), Year 2000 Report". 2000. http://www.thearda.com/mapsReports/reports/selectCounty.asp?state=36&county=25001. Retrieved 2010-03-21. Churches were asked for their membership numbers. ARDA estimates that most of the churches not reporting were black Protestant congregations.
- ^ Roberts, Sam (2007-03-27). "In Surge in Manhattan Toddlers, Rich White Families Lead Way". The New York Times. http://www.nytimes.com/2007/03/23/nyregion/23kid.html. Retrieved 2007-03-27.
- ^ Roberts, Sam (2005-04-09). "In Manhattan, Poor Make 2 Cents for Each Dollar to the Rich". The New York Times. http://www.fiscalpolicy.org/SamRoberts4Sep05.htm. Retrieved 2007-03-27.
- ^ Roberts, Sam (2007-07-20). "Women are Winners". The New York Times. http://cityroom.blogs.nytimes.com/2007/07/20/podcast-women-are-winners/#more-394. Retrieved 2010-05-01.
- ^ a b New York Magazine (2006-11-06). "Mind the Income Gap". http://nymag.com/guides/money/2006/23488/. Retrieved 2006-11-08.
- ^ New York City Department of City Planning: NYC Population Projections by Age/Sex and Borough, 2000-2030
- ^ NYC To File Formal Challenge to 2010 Census under Count Question Resolution Process [1]
- ^ On the 2010 Census Results
- ^ Forstall, Richard L., Population of States and Counties of the United States: 1790 to 1990, U.S. Bureau of the Census, Washington, DC, 1996 ISBN 0-934213-48-8, (Part III, Kentucky to Oklahoma) retrieved April 3, 2011; see also the author's introduction and general notes
- ^ "Population", article by Jane Allen with tables by Nathan Kantrowitz in The Encyclopedia of New York City, edited by Kenneth T. Jackson, New-York Historical Society & Yale University Press, 1995, pages 910-914, ISBN 0-300-05536-6
- ^ The New York Times (2006-04-03). There is not evidence that the Black population is declining especially if you include those who are 1)Black in combination with other races; 2)Black Hispanic; 3)the large numbers of Black New Yorkers who are institutionalized for one reason or another(American Community Survey(US Census) does not include them in its yearly counts. For some reason, the New York Planning Commission carves the first two categories out of the US Census 2000 figures then compares the remaining figure with the 1990 figures. The US Census has found that the average age of categories 1 and 2 are between 12 and 18 years old. Follow-up surveys by the US Census Bureau and the Pew Hispanic Survey are the sources for these items. Native Born and Foreign-born Blacks have had and continue to have considerable interaction with each other including cross-cultural exchanges,sharing neighborhoods, political coalitions, and intermarriages. Theres=F30F12FB38540C708CDDAD0894DE404482 "New York City Losing Blacks, Census Shows". http://select.nytimes.com/gst/abstract.html? There is not evidence that the Black population is declining especially if you include those who are 1)Black in combination with other races; 2)Black Hispanic; 3)the large numbers of Black New Yorkers who are institutionalized for one reason or another(American Community Survey(US Census) does not include them in its yearly counts. For some reason, the New York Planning Commission carves the first two categories out of the US Census 2000 figures then compares the remaining figure with the 1990 figures. The US Census has found that the average age of categories 1 and 2 are between 12 and 18 years old. Follow-up surveys by the US Census Bureau and the Pew Hispanic Survey are the sources for these items. Native Born and Foreign-born Blacks have had and continue to have considerable interaction with each other including cross-cultural exchanges,sharing neighborhoods, political coalitions, and intermarriages. Theres=F30F12FB38540C708CDDAD0894DE404482. Retrieved 2006-04-04.
- ^ The New York Times (2006-10-01). "Black Incomes Surpass Whites in Queens". http://www.nytimes.com/2006/10/01/nyregion/01census.html?ref=nyregion. Retrieved 2006-10-01.
- ^ "New York-Newark-Bridgeport, NY-NJ-CT-PA Combined Statistical Area". American Community Survey. U.S. Census Bureau. 2008. http://factfinder.census.gov/servlet/ADPTable?_bm=y&-context=adp&-qr_name=ACS_2008_1YR_G00_DP5&-ds_name=ACS_2008_1YR_G00_&-tree_id=308&-redoLog=true&-_caller=geoselect&-geo_id=33000US408&-format=&-_lang=en. Retrieved 2010-03-18
- ^ a b c d Waxman, Sarah. "The History of New York's Chinatown". ny.com. http://www.ny.com/articles/chinatown.html. Retrieved 2009-05-04.
- ^ Semple, Kirk (2009-10-21). "In Chinatown, Sound of the Future Is Mandarin". The New York Times. http://www.nytimes.com/2009/10/22/nyregion/22chinese.html. Retrieved 2010-05-25.
- ^ a b c d Lam, Jen; Anish Parekh; Tritia Thomrongnawasouvad (2001). "Chinatown: Chinese in New York City". Voices of New York. NYU. http://www.nyu.edu/classes/blake.map2001/china.html. Retrieved 2009-05-04.
- ^ [2]Hay, Mark (2010-07-12). "The Chinatown Question;". Capital. http://www.capitalnewyork.com/article/culture/2010/07/204071/chinatown-question. Retrieved 2011-09-04.
- ^ Nancy Foner (2001). New immigrants in New York. Columbia University Press. pp. 158–161. ISBN 9780231124140. http://books.google.com/?id=MR4iVnvulMQC&pg=PA158#v=onepage&q=.
- ^ Hsiang-shui Chen. "Chinese in Chinatown and Flushing". http://qcpages.qc.edu/Asian_American_Center/research_papers/aacre15.html. Retrieved 2010-03-29.
- ^ Moskin, Julia (2010-02-09). "Northeast China Branches Out in Flushing". The New York Times. http://www.nytimes.com/2010/02/10/dining/10chine.html?scp=1&sq=dongbei%20cuisine&st=cse. Retrieved 2010-04-06.
- ^ "Brooklyn Chinese-American Association: About BCA". bca.net. Brooklyn Chinese-American Association. http://www.bca.net/aboutus.html. Retrieved 2009-04-22.[dead link]
- ^ Zhao, Xiaojian (2010-01-19). The new Chinese America: Class, economy, and social hierarchy. ISBN 9780813546926. http://books.google.com/?id=6glk5aF8FQYC&pg=PA103&dq=Little+Fuzhou+in+Brooklyn+Chinatown#v=onepage&q=Little%20Fuzhou%20in%20Brooklyn%20Chinatown&f=false.
- ^ "WenZhounese in New York". WenZhounese.info. http://wenzhounese.angelfire.com/wholesales.html. Retrieved 2010-10-01.
- ^ http://www.indypressny.org/nycma/voices/25/news/news_1/
- ^ Marques, Aminda (1985-08-04). "IF YOU'RE THINKING OF LIVING IN; ELMHURST". The New York Times (The New York Times Company). http://www.nytimes.com/1985/08/04/realestate/if-you-re-thinking-of-living-in-elmhurst.html?sec=&spon=&pagewanted=all. Retrieved 2009-05-04.
- ^ http://www.nycgovparks.org/sub_your_park/historical_signs/hs_historical_sign.php?id=12036
- ^ Asian American Federation of New York (2004). "Census Profile:New York City's Indian American Population" (PDF). http://www.aafny.org/cic/briefs/indianamer.pdf. Retrieved 2007-03-28. Asian American Federation of New York (2004). "Census Profile:New York City's Pakistani American Population" (PDF). http://www.aafny.org/cic/briefs/pakistani.pdf. Retrieved 2007-04-21.
- ^ Benson, Kathleen., Kayal, Philip M. A Community of Many Worlds: Arab Americans in New York City. Museum of the City of New York/Syracuse University Press. New York, 2002. Page 3
- ^ Benson, Kathleen., Kayal, Philip M. A Community of Many Worlds: Arab Americans in New York City. Museum of the City of New York/Syracuse University Press. New York, 2002. Page 12
- ^ Benson, Kathleen., Kayal, Philip M. A Community of Many Worlds: Arab Americans in New York City. Museum of the City of New York/Syracuse University Press. New York, 2002. Page 24
- ^ http://aai.3cdn.net/9298c231f3a79e30c6_g7m6bx9hs.pdf Arab American Population Highlights Arab American Institute Foundation
- ^ http://www.jewishvirtuallibrary.org/jsource/US-Israel/arabpop.html
- ^ http://archive.newsmax.com/archives/articles/2003/12/3/192906.shtml
- ^ New York City Department of City Planning (2000). "2000 Census" (PDF). http://www.nyc.gov/html/dcp/pdf/census/mpsfsb7.pdf. Retrieved 2007-05-24.
- ^ New York City Department of City Planning (2000). "2000 Census" (PDF). http://www.nyc.gov/html/dcp/pdf/census/mpsfsb10.pdf. Retrieved 2007-05-24.
- ^ Moore, Laoise T.; McEvoy, B; Cape, E; Simms, K; Bradley, DG (February 2006). "A Y-Chromosome Signature of Hegemony in Gaelic Ireland". The American Journal of Human Genetics 78 (2): 334–338. doi:10.1086/500055. PMC 1380239. PMID 16358217. http://www.pubmedcentral.nih.gov/articlerender.fcgi?tool=pmcentrez&artid=1380239. See also Wade, Nicholas (2006-01-18). "If Irish Claim Nobility, Science May Approve". New York Times. http://www.nytimes.com/2006/01/18/science/18irish.html?ex=1149652800&en=2336ca46c937614b&ei=5070. Retrieved 2006-07-16.
- ^ New York City Department of City Planning (2000). "2000 Census" (PDF). http://www.nyc.gov/html/dcp/pdf/census/mpsfsb11.pdf. Retrieved 2007-05-24.
- ^ New York City Department of City Planning (2000). "2000 Census" (PDF). http://www.nyc.gov/html/dcp/pdf/census/mpsfsb13.pdf. Retrieved 2007-05-24.
- ^ "Religion: Ramadan". Time. 1937-11-15. http://www.time.com/time/magazine/article/0,9171,758343,00.html. Retrieved 2010-05-05.
- ^ http://www.columbia.edu/cu/news/01/05/muslim.html
- ^ http://www.columbia.edu/cu/news/04/09/muslims.html
- ^ a b c d http://web.gc.cuny.edu/lastudies/latinodataprojectreports/The%20Latino%20Population%20of%20New%20York%20City%202009.pdf
- ^ http://www.nyc.gov/html/dcp/pdf/census/census2010/t_sf1_p8_nyc.pdf
External links
- New York City Department of City Planning Population Division [6]
- New York City Department of City Planning Census Fact Finder [7]
- Jewish communities in New York City
- The Newest New Yorkers, 2000, by the NYC Population Division, uses Census information and other federal and local data to take a detailed look at the origins, spatial settlement, and other characteristics of the foreign-born population in New York City and in the larger metropolitan region.[8]
- http://www.muninetguide.com/index.php
New York City History · Neighborhoods · Architecture · Skyscrapers · Tourism · Attractions · Culture · Books · Arts · Parks · Cuisine · Dialect · People · Music · Sports · Media · Economy · Companies · Education · Schools · Government · Mayor · Central Park · Council · Fire · Police · Landmarks · Crime · Elections · Geography · Harbor · Gardens · Flag · Environment · Demographics · Enclaves · Transportation · Hospitals · Lists · Images · Portal Categories:
- Demographics of New York City
- Demographics by city


Wikimedia Foundation. 2010.