- Demographics of India
-
This article is about the people from India. For Other uses, see Indian (disambiguation).
Demographics of India 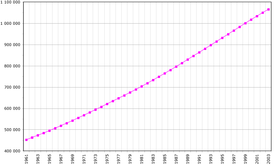
Population of India, 1961-2003Population: 1,210,193,422 (2011 est.) (2nd) Growth rate: 1.41% (2009 est.) (93rd) Birth rate: 22.22 births/1,000 population (2009 est.) Death rate: 6.4 deaths/1,000 population (2009 est.) Life expectancy: 69.89 years (2009 est.) –male: 67.46 years (2009 est.) –female: 72.61 years (2009 est.) Fertility rate: 2.68 children born/woman (2010 est.) (82nd) Infant mortality rate: 30.15 deaths/1,000 live births (2009 est.) Age structure: 0-14 years: 31.1% (male 190,075,426/female 172,799,553) (2009 est.) 15-64 years: 63.6% (male 381,446,079/female 359,802,209) (2009 est.) 65-over: 5.3% (male 29,364,920/female 32,591,030) (2009 est.) Sex ratio: At birth: 1.12 male(s)/female (2009 est.) Under 15: 1.10 male(s)/female (2009 est.) 15-64 years: 1.06 male(s)/female (2009 est.) 65-over: 0.90 male(s)/female (2009 est.) Nationality: Major ethnic: See Ethnic Groups of India Language: Official: See Languages of India The demographics of India are inclusive of the second most populous country in the world, with over 1.21 billion people (2011 census), more than a sixth of the world's population. Already containing 17.5% of the world's population, India is projected to be the world's most populous country by 2025, surpassing China, its population reaching 1.6 billion by 2050.[1][2] Its population growth rate is 1.41%, ranking 93rd in the world.
India has more than 50% of its population below the age of 25 and more than 65% hovers below the age of 35. It is expected that, in 2020, the average age of an Indian will be 29 years, compared to 37 for China and 48 for Japan; and, by 2030, India's dependency ratio should be just over 0.4.[3]
India has more than two thousand ethnic groups, and every major religion is represented, as are four major families of languages (Indo-European, Dravidian, Austro-Asiatic and Tibeto-Burman languages) as well as two language isolates (the Nihali language[4] spoken in parts of Maharashtra and the Burushaski language spoken in parts of Jammu and Kashmir).
Further complexity is lent by the great variation that occurs across this population on social parameters such as income and education. Only the continent of Africa exceeds the linguistic, genetic and cultural diversity of the nation of India.[5]
Salient features
India occupies 2.4% of the world's land area and supports over 17.5% of the world's population. India has more arable land area than any country except the United States,[6] and more water area than any country except Russia, Canada and the United States. Indian life revolves mostly around agriculture and allied activities in small villages, where the overwhelming majority of Indians live. As per the 2001 census, 72.2% of the population[7] lives in about 638,000 villages[8] and the remaining 27.8%[7] lives in more than 5,100 towns and over 380 urban agglomerations.[9]
Where does India stand today globally?
Sl No. Category Global Ranking 1 Area 7th 2 Population 2nd 3 Population growth rate 93rd 4 Labour force 2nd 5 GDP (nominal) 10th 6 GDP (PPP) 4th 7 GDP (nominal) per capita 138th 8 GDP (PPP) per capita 127th 9 GDP (real) growth rate 5th 10 Human Development Index 134th 11 Exports 16th 12 Imports 11th 13 Current Account balance 169th 14 Received FDI 29th 15 Foreign Exchange reserves 6th 16 External debt 26th 17 Public debt 29th 18 Electricity consumption 5th 19 Mobile phone users 2nd 20 Internet users 4th 21 Motor vehicle production 7th 22 Military expenditure 10th 23 Active troops 3rd 24 Rail network 4th 25 Road network 3rd List of States and Union territories by demographics
Historical population of India Census Pop. %± 1951 361,088,000 — 1961 439,235,000 21.6% 1971 548,160,000 24.8% 1981 683,329,000 24.7% 1991 846,421,000 23.9% 2001 1,028,737,000 21.5% 2011 1,210,193,422 17.6% Source:Census of India[10] Rank State or union territory Population (2011) %[11] Rural Pop.[12] Urban Pop.[12] Area km²[13] Density (per km²) Area mi² Density (per mi²) Sex ratio 1 Uttar Pradesh 199,581,520 16.49% 131,658,339 34,539,582 240,928 828 93,022.8 2146 908 2 Maharashtra 112,372,972 9.29% 55,777,647 41,100,980 307,713 365 118,808.7 815 946 3 Bihar 103,804,637 8.58% 74,316,709 8,681,800 94,163 1102 36,356.5 2,855 916 4 West Bengal 91,347,736 7.55% 57,748,946 22,427,251 88,752 1030 34,267.3 2,666 908 5 Andhra Pradesh 84,665,533 7.00% 55,401,067 20,808,940 275,045 308 106,195.5 797 912 6 Madhya Pradesh 72,597,565 6.00% 44,380,878 15,967,145 308,245 236 119,014.1 610 930 7 Tamil Nadu 72,138,958 5.96% 34,921,681 27,483,998 130,058 555 50,215.7 1,437 945 8 Rajasthan 68,621,012 5.67% 43,292,813 13,214,375 342,239 201 132,139.2 519 926 9 Karnataka 61,130,704 5.05% 34,889,033 17,961,529 191,791 319 74,050.9 826 968 10 Gujarat 60,383,628 4.99% 31,740,767 18,930,250 196,024 308 75,685.3 798 918 11 Orissa 41,947,358 3.47% 31,287,422 5,517,238 155,707 269 60,118.8 698 905 12 Kerala 33,387,677 2.76% 23,574,449 8,266,925 38,863 859 15,005.1 2,225 1,084 13 Jharkhand 32,966,238 2.72% 20,952,088 5,993,741 79,714 414 30,777.7 1071 947 14 Assam 31,169,272 2.58% 23,216,288 3,439,240 78,438 397 30,285.1 1029 954 15 Punjab 27,704,236 2.29% 16,096,488 8,262,511 50,362 550 19,444.9 1,425 893 16 Haryana 25,353,081 2.09% 15,029,260 6,115,304 44,212 573 17,070.3 1,485 877 17 Chhattisgarh 25,540,196 2.11% 16,648,056 4,185,747 135,191 189 52,197.5 489 991 18 Jammu and Kashmir 12,548,926 1.04% 7,627,062 2,516,638 222,236 56 85,805.8 146 883 19 Uttarakhand 10,116,752 0.84% 6,310,275 2,179,074 53,483 189 20,649.9 490 963 20 Himachal Pradesh 6,856,509 0.57% 5,482,319 595,581 55,673 123 21,495.5 319 974 21 Tripura 3,671,032 0.30% 2,653,453 545,750 10,486 350 4,048.7 907 921 22 Meghalaya 2,964,007 0.24% 1,864,711 454,111 22,429 132 8,659.9 342 986 23 Manipurβ 2,721,756 0.22% 1,590,820 575,968 22,327 122 8,620.5 316 987 24 Nagaland 1,980,602 0.16% 1,647,249 342,787 16,579 119 6,401.2 309 931 25 Goa 1,457,723 0.12% 677,091 670,577 3,702 394 1,429.4 1020 968 26 Arunachal Pradesh 1,382,611 0.11% 870,087 227,881 83,743 17 32,333.4 43 920 27 Mizoram 1,091,014 0.09% 447,567 441,006 21,081 52 8,139.4 134 975 28 Sikkim 607,688 0.05% 480,981 59,870 7,096 86 2,739.8 222 889 UT1 Delhi 16,753,235 1.38% 944,727 12,905,780 11,297 9,340 572.6 29,258 866 UT2 Puducherry 1,244,464 0.10% 325,726 648,619 479 2,598 184.9 6,730 1,038 UT3 Chandigarh 1,054,686 0.09% 92,120 808,515 114 9,252 44.0 23,970 818 UT4 Andaman and Nicobar Islands 379,944 0.03% 239,954 116,198 8,249 46 3,185.0 119 878 UT5 Dadra and Nagar Haveli 342,853 0.03% 170,027 50,463 491 698 189.6 1,808 775 UT6 Daman and Diu 242,911 0.02% 100,856 57,348 112 2,169 43.2 5,623 618 UT7 Lakshadweep 64,429 0.01% 33,683 26,967 32 2,013 12.4 5,196 946 Total India 1,210,193,422 100.00% 742,490,639 286,119,689 3,287,240 382 1,269,210.5 954 940 Districts in India: Census 2011
State/UT Code India/State/UT No. of districts in 2001 No. of Districts in 2011 No. of Districts without any geographical change 01 Jammu & Kashmir 14 22 5 02 Himachal Pradesh 12 12 12 03 Punjab 17 20 8 04 Chandigarh 1 1 1 05 Uttarakhand 13 13 11 06 Haryana 19 21 17 07 NCT of Delhi 9 9 9 08 Rajasthan 32 33 18 09 Uttar Pradesh 70 71 47 10 Bihar 37 38 34 11 Sikkim 4 4 4 12 Arunachal Pradesh 13 16 10 13 Nagaland 8 11 4 14 Manipur 9 9 9 15 Mizoram 8 8 4 16 Tripura 4 4 2 17 Meghalaya 7 7 4 18 Assam 23 27 15 19 West Bengal 18 19 17 20 Jharkhand 18 24 9 21 Orissa 30 30 26 22 Chattisgarh 16 18 14 23 Madhya Pradesh 45 50 36 24 Gujarat 25 26 20 25 Daman & Diu 2 2 2 26 Dadra & Nagar Haveli 1 1 1 27 Maharashtra 35 35 31 28 Andhra Pradesh 23 23 23 29 Karnataka 27 30 24 30 Goa 2 2 2 31 Lakshadweep 1 1 1 32 Kerala 14 14 14 33 Tamil Nadu 30 32 25 34 Puducherry 4 4 4 35 Andaman & Nicobar Islands 2 3 1 INDIA 593 640 464 Religious demographics
Main article: Religion in IndiaReligions of India[15][note 1][note 2] Religion Population Percent All religions 1,028,610,328 100.00% Hindus 827,578,868 80.5% Muslims 138,188,240 13.4% Christians 24,080,016 2.3% Sikhs 19,215,730 1.9% Buddhists 7,955,207 0.8% Jains 4,225,053 0.4% Bahá'ís 1 953 112 0.18% Others 4,686,588 0.32% Religion not stated 727,588 0.1%
India contains the majority of the world's Zoroastrians (even ahead of Iran), Sikhs, Hindus, Jains and Bahá'ís. India is also home to the third-largest Muslim population in the world after Indonesia and Pakistan.Religious majorities vary greatly by state. The majority of states have a Hindu majority. However, Jammu and Kashmir and Lakshadweep are Muslim majority states; Nagaland, Mizoram and Meghalaya are Christian majority; Punjab is majority Sikh; Sikkim and Ladakh are Buddhist majority areas[citation needed]
The table below summarises the findings of the 2001 census with regard to religion in India:
- All figures in %.
- Others including Bahá'ís, Jews, and Parsis.
- Tribal Animists (and non religious) are grouped under Others after 1926 (1931 census onwards)
Table 2: Census information for 2001* Composition Hindus[16] Muslims[17] Christians[18] Sikhs[19] Buddhist[20] Jains[21] Others[22] % total of population 2001 80.5% 13.4% 2.3% 1.9% 0.8% 0.4% 0.6% 10-Yr Growth % (est '91–'01)[23]* 20.3% 29.5% 22.6% 18.2% 24.5% 26.0% 103.1% Sex ratio† (avg. 944) 935 940 1009 895 955 940 1000 Literacy rate (71.7% for Age 7 & above)[24] 75.5 60.0 90.3 70.4 73.0 95.0 50.0 Work Participation Rate 40.4 31.3 39.7 37.7 40.6 32.9 48.4 Rural sex ratio[23] 944 953 1001 895 958 937 995 Urban sex ratio[23] 922 907 1026 886 944 941 966 Child sex ratio (0–6 yrs) 925 950 964 786 942 870 976 N.B. Table excludes Mao-Maram, Paomata and Purul subdivisions of Senapati District of Manipur state.
* The data is "unadjusted" (without excluding Assam and Indian-administered Kashmir); 1981 census was not conducted in Assam and 1991 census was not conducted in Jammu and Kashmir.
† No. of females/1000 males.
India's 2011 census shows a serious decline in the number of girls under the age of seven - activists fear eight million female foetuses may have been aborted between 2001 and 2011.[25]
Population within the age group of 0-6: Census 2011
State/UT Code India/State/UT Persons Males Females 01 Jammu & Kashmir 20,08,642 10,80,662 9,27,980 02 Himachal Pradesh 7,63,864 4,00,681 3,63,183 03 Punjab 29,41,570 15,93,262 13,48,308 04 Chandigarh 1,17,953 63,187 54,766 05 Uttarakhand 13,28,844 7,04,769 6,24,075 06 Haryana 32,97,724 18,02,047 14,95,677 07 NCT of Delhi 19,70,510 10,55,735 9,14,775 08 Rajasthan 1,05,04,916 55,80,212 49,24,704 09 Uttar Pradesh 2,97,28,235 1,56,53,175 1,40,75,060 10 Bihar 1,85,82,229 96,15,280 89,66,949 11 Sikkim 61,077 31,418 29,659 12 Arunachal Pradesh 2,02,759 1,03,430 99,329 13 Nagaland 2,85,981 1,47,111 1,38,870 14 Manipur 3,53,237 1,82,684 1,70,553 15 Mizoram 1,65,536 83,965 81,571 16 Tripura 4,44,055 2,27,354 2,16,701 17 Meghalaya 5,55,822 2,82,189 2,73,633 18 Assam 45,11,307 23,05,088 22,06,219 19 West Bengal 1,01,12,599 51,87,264 49,25,335 20 Jharkhand 52,37,582 26,95,921 25,41,661 21 Orissa 50,35,650 26,03,208 24,32,442 22 Chhattisgarh 3,584,028 1,824,987 1,759,041 23 Madhya Pradesh 10,548,295 5,516,957 5,031,338 24 Gujarat 7,494,176 3,974,286 3,519,890 25 Daman & Diu 25,880 13,556 12,324 26 Dadra & Nagar Haveli 49,196 25,575 23,621 27 Maharashtra 12,848,375 6,822,262 6,026,113 28 Andhra Pradesh 8,642,686 4,448,330 4,194,356 29 Karnataka 6,855,801 3,527,844 3,327,957 30 Goa 139,495 72,669 66,826 31 Lakshadweep 7,088 3,715 3,373 32 Kerala 3,322,247 1,695,935 1,626,312 33 Tamil Nadu 6,894,821 3,542,351 3,352,470 34 Puducherry 127,610 64,932 62,678 35 Andaman & Nicobar Islands 39,497 20,094 19,403 INDIA 158,789,287 82,952,135 75,837,152 Population above the age of 7: Census 2011
State/UT Code India/State/UT Persons Males Females 01 Jammu & Kashmir 1,05,40,284 55,84,889 49,55,385 02 Himachal Pradesh 60,92,645 30,73,211 30,19,434 03 Punjab 2,47,62,666 1,30,41,557 1,17,21,109 04 Chandigarh 9,36,733 5,17,095 4,19,638 05 Uttarakhand 87,87,908 44,49,409 43,38,499 06 Haryana 2,20,55,357 1,17,03,083 1,03,52,274 07 NCT of Delhi 1,47,82,725 79,20,675 68,62,050 08 Rajasthan 5,81,16,096 3,00,39,874 2,80,76,222 09 Uttar Pradesh 16,98,53,242 8,89,43,240 8,09,10,002 10 Bihar 8,52,22,408 4,45,70,067 4,06,52,341 11 Sikkim 5,46,611 2,90,243 2,56,368 12 Arunachal Pradesh 11,79,852 6,16,802 5,63,050 13 Nagaland 16,94,621 8,78,596 8,16,025 14 Manipur 23,68,519 11,87,080 11,81,439 15 Mizoram 9,25,478 4,68,374 4,57,104 16 Tripura 32,26,977 16,44,513 15,82,464 17 Meghalaya 24,08,185 12,10,479 11,97,706 18 Assam 2,66,57,965 1,36,49,839 1,30,08,126 19 West Bengal 8,12,35,137 4,17,40,125 3,94,95,012 20 Jharkhand 2,77,28,656 1,42,35,767 1,34,92,889 21 Orissa 3,69,11,708 1,85,98,470 1,83,13,238 22 Chattisgarh 2,19,56,168 1,10,02,928 1,09,53,240 23 Madhya Pradesh 6,20,49,270 3,20,95,963 2,99,53,307 24 Gujarat 5,28,89,452 2,75,07,996 2,53,81,456 25 Daman & Diu 2,17,031 1,36,544 80,487 26 Dadra & Nagar Haveli 2,93,657 1,67,603 1,26,054 27 Maharashtra 9,95,24,597 5,15,39,135 4,79,85,462 28 Andhra Pradesh 7,60,22,847 3,80,61,551 3,79,61,296 29 Karnataka 5,42,74,903 2,75,29,898 2,67,45,005 30 Goa 13,18,228 6,68,042 6,50,186 31 Lakshadweep 57,341 29,391 27,950 32 Kerala 3,00,65,430 1,43,25,355 1,57,40,075 33 Tamil Nadu 6,52,44,137 3,26,16,520 3,26,27,617 34 Puducherry 11,16,854 5,45,553 5,71,301 35 Andaman & Nicobar Islands 3,40,447 1,82,236 1,58,211 INDIA 1,05,14,04,135 54,07,72,113 51,06,32,022 Literacy Rate in India: Census 2011
State/UT Code India/State/UT Literate Persons (%) Males (%) Females (%) 01 Jammu & Kashmir 68.74 78.26 58.01 02 Himachal Pradesh 83.78 90.83 76.60 03 Punjab 76.68 81.48 71.34 04 Chandigarh 86.43 90.54 81.38 05 Uttarakhand 79.63 88.33 70.70 06 Haryana 76.64 85.38 66.77 07 NCT of Delhi 86.34 91.03 80.93 08 Rajasthan 67.06 80.51 52.66 09 Uttar Pradesh 69.72 79.24 59.26 10 Bihar 63.82 73.39 53.33 11 Sikkim 82.20 87.29 76.43 12 Arunachal Pradesh 66.95 73.69 59.57 13 Nagaland 80.11 83.29 76.69 14 Manipur 79.85 86.49 73.17 15 Mizoram 91.58 93.72 89.40 16 Tripura 87.75 92.18 83.15 17 Meghalaya 75.48 77.17 73.78 18 Assam 73.18 78.81 67.27 19 West Bengal 77.08 82.67 71.16 20 Jharkhand 67.63 78.45 56.21 21 Orissa 73.45 82.40 64.36 22 Chattisgarh 71.04 81.45 60.59 23 Madhya Pradesh 70.63 80.53 60.02 24 Gujarat 79.31 87.23 70.73 25 Daman & Diu 87.07 91.48 79.59 26 Dadra & Nagar Haveli 77.65 86.46 65.93 27 Maharashtra 82.91 89.82 75.48 28 Andhra Pradesh 67.66 75.56 59.74 29 Karnataka 75.60 82.85 68.13 30 Goa 87.40 92.81 81.84 31 Lakshadweep 92.28 96.11 88.25 32 Kerala 93.91 96.02 91.98 33 Tamil Nadu 80.33 86.81 73.86 34 Puducherry 86.55 92.12 81.22 35 Andaman & Nicobar Islands 86.27 90.11 81.84 INDIA 74.04 82.14 65.46 Linguistic demographics
Main article: List of languages by number of native speakers in India43% of the Hindus speak Hindi while the rest speak Assamese, Bangla, Gujarati, Kannada, Malayalam, Marathi, Tamil, Telugu, Punjabi and other languages. Almost 45% of the Muslims speak Urdu while the rest speak Assamese, Bangla, Gujarati, Kashmiri, Malayalam, Tamil, Telugu and other languages. About one-third of the Christians speak Malayalam, one-sixth speak Tamil while the rest speak a variety of languages. In total, there are 1,652 languages and dialects spoken in India.[26]
Languages of India by number of native speakers as per the 2001 census[27] Rank Language Speakers Percentage 1 Hindi dialects[28] 422,048,642 41.03% 2 Bengali 83,369,769 8.11% 3 Telugu 74,002,856 7.19% 4 Marathi 71,936,894 6.99% 5 Tamil 60,793,814 5.91% 6 Urdu 51,536,111 5.01% 7 Gujarati 46,091,617 4.48% 8 Kannada 37,924,011 3.69% 9 Malayalam 33,066,392 3.21% 10 Oriya 33,017,446 3.21% 11 Punjabi 29,102,477 2.83% 12 Assamese 13,168,484 1.28% 13 Maithili 12,179,122 1.18% 14 Bhili/Bhilodi 9,582,957 0.93% 15 Santali 6,469,600 0.63% 16 Kashmiri 5,527,698 0.54% 17 Nepali 2,871,749 0.28% 18 Gondi 2,713,790 0.26% 19 Sindhi 2,535,485 0.25% 20 Konkani 2,489,015 0.24% 21 Dogri 2,282,589 0.22% 22 Khandeshi 2,075,258 0.20% 23 Kurukh 1,751,489 0.17% 24 Tulu 1,722,768 0.17% 25 Meitei (Manipuri) 1,466,705* 0.14% 26 Bodo 1,350,478 0.13% 27 Khasi 1,128,575 0.112% 28 Mundari 1,061,352 0.105% 29 Ho 1,042,724 0.103% N.B. The percentage of speakers of each language for 2001 has been worked out on the total population of India (excluding Mao-Maram, Paomata and Purul subdivisions of Senapati District of Manipur state due to cancellation of census results).
* Excludes Mao-Maram, Paomata and Purul of Senapati District.
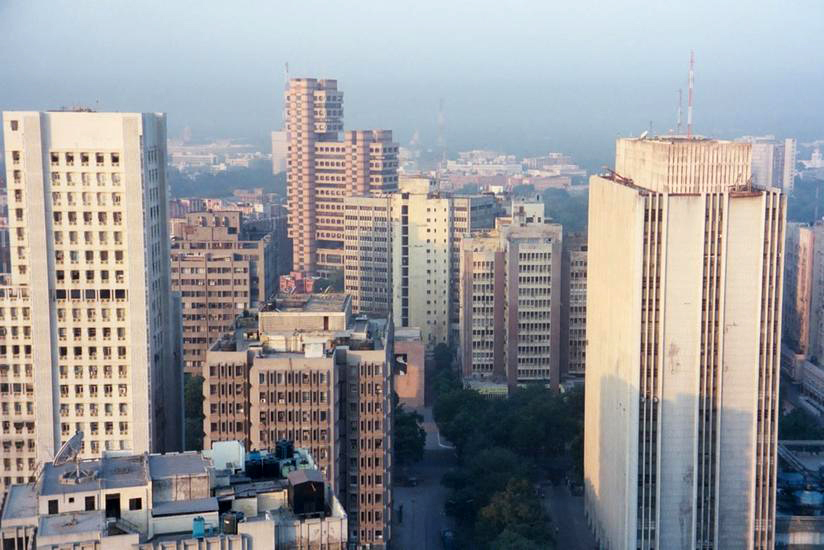
Largest cities
Largest cities of India
World Gazetteer[29]Rank City Name State/UT Pop. Rank City Name State/UT Pop. 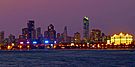
Mumbai
1 Mumbai Maharastra 13,830,884 11 Jaipur Rajastan 3,210,570 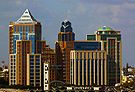
Bengaluru
2 Delhi Delhi 12,565,901 12 Lucknow Uttar Pradesh 2,750,447 3 Bengaluru Karnataka 8,425,970 13 Nagpur Maharastra 2,447,063 4 Kolkata West Bengal 5,138,208 14 Patna Bihar 1,875,572 5 Chennai Tamilnadu 4,616,639 15 Indore Madhya Pradesh 1,854,930 6 Hyderabad Andhra Pradesh 4,068,611 16 Thane Maharastra 1,807,616 7 Ahmedabad Gujarat 3,959,432 17 Bhopal Madhya Pradesh 1,792,203 8 Pune Maharastra 3,446,330 18 Ludhiana Punjab 1,740,247 9 Surat Gujarat 3,344,135 19 Agra Uttar Pradesh 1,686,976 10 Kanpur Uttar Pradesh 3,221,435 20 Pimpri Maharashtra 1,637,905 CIA World Factbook demographic statistics
The following demographic statistics are from the CIA World Factbook, unless otherwise indicated.
 Chart showing the Total Fertility Rate of Indian states (SRS survey 1996-98)[30]
- Total Population
1,166,079,217 (July 2009 est. CIA)[31] 1,028.7 million (2001 Census final figures, March 1 enumeration and estimated 124,000 in areas of Manipur that could not be covered in the enumeration)
 Map showing the population density of each district in India.
- Rural Population
72.2%, male: 381,668,992, female: 360,948,755 (2001 Census)
- Age structure
0–14 years: 30.8%, male: 188,208,196, female: 171,356,024
15–64 years: 64.3%, male: 386,432,921, female: 364,215,759
65+ years: 4.9%, male: 27,258,259, female: 30,031,289 (2007 est.)- Median age
25.1 years
- Population growth rate
1.548% (2009 est.)
- Birth rate
21.76 births/1,000 population (2009 est.)
- Death rate
6.4 deaths/1,000 population (2009 est.)
 Map showing the literacy rate of each district in India.
- Literacy rate
71.7% (Age 7 & above) [24]
- Percent of the population under the poverty line
22% (2006 est.)
- Unemployment Rate
7.8%
- Net migration rate
−0.05 migrant(s)/1,000 population (2007 est.)
- Sex ratio
at birth: 1.12 male(s)/female
under 10 years: 1.14 male(s)/female
15–24 years: 1.09 male(s)/female
24–64 years: 1.06 male(s)/female
65 years and over: 0.908 male(s)/female
total population: 1.08 male(s)/female (2011 est.)- Infant mortality rate
total: 30.15 deaths/1,000 live births (2009 est.) male: 34.61 deaths/1,000 live births female: 25.17 deaths/1,000 live births
- Life expectancy at birth
total population: 69.89 years
male: 67.46 years
female: 72.61 years (2007 est.)- Total fertility rate
2.72 children born/woman (2009 est.), although more up to date statistics indicate that India's TFR was 2.6 in 2008 [32] The TFR (Total number of children born per women) according to Religion in 2001 was :
Hindus — 2.0 Muslims — 2.4 Sikhs — 2.1 Christians — 2.1 Buddhists — 2.1 Jains — 1.4 Animists and Others — 2.99 Tribals — 3.16 Scheduled Castes — 2.89[citation needed]
- Religions
Hindu 80.5% Muslim 13.4% Christian 2.3% Sikh 1.8% Buddhists 0.8% Jains 0.4% others 0.7% unspecified 0.1% (2001 Census) [33][34][35][36]
- Scheduled Castes and Tribes
Scheduled Castes: 16.2% (2001 Census) Scheduled Tribes: 8.2% (2001 Census)
Languages: See Languages of India and List of Indian languages by total speakers. There are 216 languages with more than 10,000 native speakers in India. The largest of these is Hindi with some 337 million (the second largest being Bangla with some 207 million). 22 languages are recognized as official languages. In India, there are 1,652 languages and dialects in total.[26][37]
Population projections
India is projected to overtake China as the world's most populous nation by 2030. India's population growth has raised concerns that it would lead to widespread unemployment and political instability.[38][39]
Source:[40]
- 2020: 1,326,093,000
- 2030: 1,460,743,000
- 2040: 1,571,715,000
- 2050: 1,656,554,000
2020 Estimate
Source:[41]
Year Under 15 15–64 65+ Total 2000 361 604 45 1010 2005 368 673 51 1093 2010 370 747 58 1175 2015 372 819 65 1256 2020 373 882 76 1331 Ethnic groups
Ethnic groups of India This tree diagram depicts the relationships of the major ethnic, linguistic and religious groups in India.[citation needed] For example, an H under Gujarati implies a Hindu, Gujarati-speaking Indian of Indo-Aryan ancestry. However this is not a hard and fast rule. For example, in India many members of the Muslim community are of Arab, Iranian or Turkish, and Afghan origins and the Christian community are of Jewish and European origins. This list excludes caste groups like the Dalits which is a socio-political identity across linguistic, religious and racial lines. Indeed, it should be noted that the terms 'Indo-Aryan' and 'Dravidian' refer more to the differences in ethnic ancestry and language rather than racial differences.Indians Indo-Aryans Mongoloids Dravidians Tribals Konkani (कोंकणे) Marathi (मराठी माणसं) Gujarati (ગુજરાતી લોકો) Punjabi (ਪੰਜਾਬੀ)Kashmiri (کٲشُر)Hindi (हिन्दी) Oriya (ଓଡିଆ) Bengali (বাঙালী)Assamese (অসম)Meghalayans Mizo Tripuri (ত্রিপুরা)Manipuri (মনিপুরি)Naga Lepcha(Róng) (རྫོང)Arunachali (རྫོང་ཁ་)Tamizh (தமிழர்) Telugu (తెలుగు)Kannadiga (ಕನ್ನಡಿಗ)Malayali (മലയാളി)H, C H, M, B, J H, M, J S, H, M S, H, M H, M H, C H, M H, M C, H, T C, T H, T H, C C, T B, H B, T, H H, C, M, A H, M, C H, M, C H, C, M, A The national Census of India does not recognize racial or ethnic groups within India,[42] but recognizes many of the tribal groups as Scheduled Castes and Tribes (see list of Scheduled Tribes in India).
Harry W. Blair has explained that
With British autocracy went a consuming interest in ethnography that produced very thorough census of caste during the Raj but as autocracy was replaced with democracy and elections, ethnographic passion was also replaced by an official egalitarianism that refused to countenance the reporting of caste in the government censuses for any groups other than the Scheduled Castes.[43]It should be noted that Indo-Aryan, Dravidian, Tibeto-Burman and Austro-Asiatic are mainly linguistic terms and denote speakers of these linguistic groups.
For a list of ethnic groups in the Republic of India (as well as neighboring countries) see ethnic groups of the Indian subcontinent or the tree diagram above.
Genetics
See also: Y-DNA haplogroups in South Asian populationsY-chromosome DNA
Y-Chromosome DNA Y-DNA represents the male lineage, The Indian Y-chromosome pool may be summarized as follows where haplogroups R1a, H, R2, L & NOP comprise generally more than 80% of the total chromosomes.[45]
Mitochondrial DNA
Mitochondrial DNA mtDNA represents the female lineage. The Indian mitochondrial DNA is primarily made up of Haplogroup M[47]
- Haplogroup M ~ 60%
- Haplogroup UK ~ 15%
- Haplogroup N ~ 25% (Excluding UK)
See also
- Ethnic groups of India
- Indian diaspora
- Racial groups of India
- Caste system in India
- Demography of Central Asia
Government:
Lists:
Notes
References
- ^ "India's population 'to be biggest' in the planet". BBC News. 2004-08-18. http://news.bbc.co.uk/2/hi/3575994.stm. Retrieved 2011-09-24.
- ^ US Census Bureau, Demographic Internet Staff. "United States Census Bureau - International Data Base (IDB)". Census.gov. http://www.census.gov/ipc/www/idb/informationGateway.php. Retrieved 2011-09-24.
- ^ Basu, Kaushik (2007-07-25). "India's demographic dividend". BBC News. http://news.bbc.co.uk/2/hi/south_asia/6911544.stm. Retrieved 2011-09-24.
- ^ SIL International. "Ethnologue report for Language Isolate". http://www.ethnologue.com/show_family.asp?subid=90087. Retrieved 2007-10-11.
- ^ India, a Country Study United States Library of Congress, Note on Ethnic groups
- ^ GM Crops Around the World – an accurate picture[dead link] GM Freeze, Table 3
- ^ a b Rural-Urban distribution Census of India: Census Data 2001: India at a glance >> Rural-Urban Distribution. Office of the Registrar General and Census Commissioner, India. Retrieved on 2008-11-26.
- ^ Number of Villages Census of India: Number of Villages Office of the Registrar General and Census Commissioner, India. Retrieved on 2008-11-26.
- ^ Urban Agglomerations and Towns Census of India: Urban Agglomerations and Towns. Office of the Registrar General and Census Commissioner, India. Retrieved on 2008-11-26.
- ^ "Census Population" (PDF). Census of India. Ministry of Finance India. http://indiabudget.nic.in/es2006-07/chapt2007/tab97.pdf. Retrieved 18 December 2008.
- ^ "Ranking of States and Union territories by population size: 1991 and 2001". Government of India (2001). Census of India. pp. 5–6. http://www.censusindia.gov.in/Data_Products/Library/Provisional_Population_Total_link/PDF_Links/chapter3.pdf. Retrieved 2008-12-12.
- ^ a b "Population". Government of India (2001). Census of India. http://www.censusindia.gov.in/Census_Data_2001/Census_Data_Online/Population/Total_Population.aspx. Retrieved 2008-10-26.
- ^ "Area of India/state/district". Government of India (2001). Census of India. http://www.censusindia.gov.in/Census_Data_2001/Census_Data_Online/Administrative_Divisions/Area_of_India.aspx. Retrieved 2008-10-27.
- ^ a b c d "Census of India Website : Office of the Registrar General & Census Commissioner, India". Censusindia.gov.in. http://www.censusindia.gov.in. Retrieved 2011-09-26.
- ^ Office of The Registrar General & Census Commissioner, India, New Delhi-110011 2011, p. 1.
- ^ "Tables: Profiles by main religions: Hindus". Census of India: Census Data 2001: India at a glance >> Religious Composition. Office of the Registrar General and Census Commissioner, India. http://www.censusindia.gov.in/Census_Data_2001/India_at_glance/religion.aspx. Retrieved 2008-11-26.
- ^ "Tables: Profiles by main religions: Muslims". Census of India: Census Data 2001: India at a glance >> Religious Composition. Office of the Registrar General and Census Commissioner, India. http://www.censusindia.gov.in/Census_Data_2001/India_at_glance/religion.aspx. Retrieved 2008-11-26.
- ^ "Tables: Profiles by main religions: Christians". Census of India: Census Data 2001: India at a glance >> Religious Composition. Office of the Registrar General and Census Commissioner, India. http://www.censusindia.gov.in/Census_Data_2001/India_at_glance/religion.aspx. Retrieved 2008-11-26.
- ^ "Tables: Profiles by main religions: Sikhs". Census of India 2001: Census Data 2001: India at a glance >> Religious Composition. Office of the Registrar General and Census Commissioner, India. http://www.censusindia.gov.in/Census_Data_2001/India_at_glance/religion.aspx. Retrieved 2008-11-26.
- ^ "Tables: Profiles by main religions: Buddhists". Census of India: Census Data 2001: India at a glance >> Religious Composition. Office of the Registrar General and Census Commissioner, India. http://www.censusindia.gov.in/Census_Data_2001/India_at_glance/religion.aspx. Retrieved 2008-11-26.
- ^ "Tables: Profiles by main religions: Jains". Census of India: Census Data 2001: India at a glance >> Religious Composition. Office of the Registrar General and Census Commissioner, India. http://www.censusindia.gov.in/Census_Data_2001/India_at_glance/religion.aspx. Retrieved 2008-11-26.
- ^ "Tables: Profiles by main religions: Other religions". Census of India: Census Data 2001: India at a glance >> Religious Composition. Office of the Registrar General and Census Commissioner, India. http://www.censusindia.gov.in/Census_Data_2001/India_at_glance/religion.aspx. Retrieved 2008-11-26.
- ^ a b c "Census of India.". Census of India. Census Data 2001: India at a glance >> Religious Composition. Office of the Registrar General and Census Commissioner, India. http://www.censusindia.gov.in/Census_Data_2001/India_at_glance/religion.aspx. Retrieved 2008-11-26.
- ^ a b http://mospi.gov.in/press_note_NSS_%20Report_no_532_19may10.pdf
- ^ Pandey, Geeta (2011-05-23). "India's unwanted girls". BBC News. http://www.bbc.co.uk/news/world-south-asia-13264301. Retrieved 23 May 2011.
- ^ a b "Mother Tongues of India According to the 1961 Census". Languageinindia.com. http://www.languageinindia.com/aug2002/indianmothertongues1961aug2002.html. Retrieved 2011-09-26.
- ^ Abstract of speakers' strength of languages and mother tongues - 2000, Census of India, 2001
- ^ includes Western Hindi, Eastern Hindi, Bihari languages, Rajasthani languages and Pahari languages.
- ^ Largest cities and towns and statistics of their population World gazetteer
- ^ "National Population Policy of India". Unescap.org. 1999-03-01. http://www.unescap.org/esid/psis/population/database/poplaws/law_india/indiaappend3.htm. Retrieved 2011-09-24.
- ^ "CIA World Factbook – ''India''". Cia.gov. https://www.cia.gov/library/publications/the-world-factbook/geos/in.html. Retrieved 2011-09-24.
- ^ "Total Fertility Rate in India on decline". Indian Express. 2010-12-10. http://www.indianexpress.com/news/total-fertility-rate-in-india-on-decline/722989/. Retrieved 2011-09-24.
- ^ Religious Composition Census of India: Census Data 2001: India at a glance >> Religious Composition. Office of the Registrar General and Census Commissioner, India. Retrieved on 2008-11-26.
- ^ International Religious Freedom Report 2007 — India International Religious Freedom Report 2007. U.S. Department of State.
- ^ "CIA's The World Factbook — India". Cia.gov. https://www.cia.gov/library/publications/the-world-factbook/geos/in.html. Retrieved 2011-09-24.
- ^ Bureau of South and Central Asian Affairs — Background Note: India
- ^ Rupert Goodwins. Smashing India's language barriers. ZDNet UK.
- ^ "Soutik Biswas's India: India's census: The good and bad news". BBC. 2011-03-31. http://www.bbc.co.uk/blogs/thereporters/soutikbiswas/2011/03/indias_census_the_good_and_bad_news.html. Retrieved 2011-09-24.
- ^ "India set to overtake China as world's most populated country after adding 180m people in a decade". Daily Mail (London). 2011-03-31. http://www.dailymail.co.uk/news/article-1371996/India-set-overtake-China-worlds-populated-country-adding-180m-people-decade.html?ito=feeds-newsxml.
- ^ US Census Bureau, Demographic Internet Staff. "International Programs - Information Gateway - U.S. Census Bureau". Census.gov. http://www.census.gov/ipc/www/idb/informationGateway.php. Retrieved 2011-09-24.
- ^ Based on P.N. Mari Bhat, "Indian Demographic Scenario 2025", Institute of Economic Growth, New Delhi, Discussion Paper No. 27/2001.
- ^ Kumar, Jayant. Census of India. 2001. September 4, 2006. Indian Census
- ^ Blair, Harry W. (1981). "Caste and the British Census in Bihar: Using Old Data to Study Contemporary Political Behavior". In Barrier, Norman Gerald. The Census in British India: New Perspectives. New Delhi: Manohar. p. 154. http://books.google.com/books?id=EzeaAAAAIAAJ. Retrieved 2011-08-28.
- ^ "A prehistory of Indian Y chromosomes: Evaluating demic diffusion scenarios". Pnas.org. http://www.pnas.org/content/103/4/843.full. Retrieved 2011-09-24.
- ^ Hammer et al. 2005, S. Sahoo et al. 2006, R. Trivedi et al. 2007, Zhao et al. 2008
- ^ http://www.biomedcentral.com/content/pdf/1471-2148-5-26.pdf
- ^ Semino et al. 2000, Kivisild et al. 2003, Metspalu et al 2004, Rajkumar et al. 2005, Chandrasekar et al. 2007, Gonzalez et al. 2007
External links
- Census of India; government site with detailed data from 2001 census
- Census of India map generator; generates maps based on 2001 census figures
- Demographic data for India; provides sources of demographic data for India
- 2001 maps; provides maps of social, economic and demographic data of India in 2001
- Population of India 2011 map; distribution of population amongst states and union territories
 Life in India
Arts and Entertainment · Caste · Cinema · Citizenship · Climate · Cuisine · Culture · Demographics · Economy · Education · Ethnic relations · Flag · Geography · Government · History · Holidays · Languages · Law · Police · Politics · Poverty · Literacy · Military · Politics · Religion · Sports · Transport

Ethnic groups in Asia Sovereign
states- Afghanistan
- Armenia
- Azerbaijan
- Bahrain
- Bangladesh
- Bhutan
- Brunei
- Burma (Myanmar)
- Cambodia
- People's Republic of China
- Cyprus
- East Timor (Timor-Leste)
- Egypt
- Georgia
- India
- Indonesia
- Iran
- Iraq
- Israel
- Japan
- Jordan
- Kazakhstan
- North Korea
- South Korea
- Kuwait
- Kyrgyzstan
- Laos
- Lebanon
- Malaysia
- Maldives
- Mongolia
- Nepal
- Oman
- Pakistan
- Philippines
- Qatar
- Russia
- Saudi Arabia
- Singapore
- Sri Lanka
- Syria
- Tajikistan
- Thailand
- Turkey
- Turkmenistan
- United Arab Emirates
- Uzbekistan
- Vietnam
- Yemen
States with limited
recognition- Abkhazia
- Nagorno-Karabakh
- Northern Cyprus
- Palestine
- Republic of China (Taiwan)
- South Ossetia
Dependencies and
other territories- Christmas Island
- Cocos (Keeling) Islands
- Hong Kong
- Macau
Categories:


Wikimedia Foundation. 2010.