- Chorley (UK Parliament constituency)
-
Coordinates: 53°39′11″N 2°37′55″W / 53.653°N 2.632°W
Chorley County constituency for the House of Commons 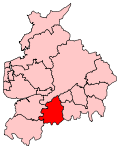
Boundary of Chorley in Lancashire.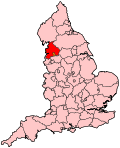
Location of Lancashire within England.County Lancashire Electorate 71,333 (December 2010)[1] Major settlements Chorley Current constituency Created 1885 Member of Parliament Lindsay Hoyle (Labour) Number of members One Created from North Lancashire Overlaps European Parliament constituency North West England Chorley is a county constituency represented in the House of Commons of the Parliament of the United Kingdom. It elects one Member of Parliament (MP) by the first past the post system of election.
Contents
Boundaries
The current Chorley constituency consists of the majority of the district borough of Chorley. As well as the central market town of Chorley itself, the seat extends into southern Lancashire rural hinterland with villages such as Adlington, Eccleston and Coppull.
Chorley's expansion is assured with the building of Buckshaw Village, an urban development sprawling over the former Royal Ordanance Site just to the east of Leyland. The town of Chorley itself is the most Labour part of the seat; the countryside villages around are more traditionally Conservative.
Following their review of parliamentary representation in Lancashire, the Boundary Commission for England created a new seat of Wyre and Preston North in the central part of the county, which caused "knock-on" effects elsewhere in the central and southern parts of Lancashire. Chorley constituency was one of the largest in electorate number terms in the county at the start of the review, which was a factor in the alterations to both its own composition and the changes to surrounding constituencies.
The electoral wards which are used to create the altered Chorley constituency are within the boundaries of the borough council. No name changes were suggested during the review process.
- Adlington and Anderton, Astley and Buckshaw, Brindle and Hoghton, Chisnall, Chorley East, Chorley North East, Chorley North West, Chorley South East, Chorley South West, Clayton-le-Woods and Whittle-le-Woods, Clayton-le-Woods North, Clayton-le-Woods West and Cuerden, Coppull, Euxton North, Euxton South, Heath Charnock and Rivington, Pennine and Wheelton and Withnell.
These changes take away from the existing seat all the population areas to the west of the M6 motorway, namely Croston, Eccleston, Bretherton and Mawdesley. These move to South Ribble. The newly formed constituency features the central areas and immediate suburban surrounds of the Chorley borough.
History
Since the 1945 general election Chorley has proved to be a key bellwether seat, changing hands between Labour and the Conservatives, however this cycle was broken in 2010 when Labour held the seat when it again had favoured bellwether status.
Members of Parliament
The Member of Parliament for the seat since 1997, Lindsay Hoyle of the Labour Party, is Chairman of Ways and Means and Deputy Speaker of the House.
Election Member [2] Party 1885 Joseph Feilden Conservative 1895 by-election David Lindsay, Lord Balniel Conservative 1913 by-election Sir Henry Hibbert Conservative 1918 Sir Douglas Hacking Coalition Conservative 1922 Conservative 1945 Clifford Kenyon Labour 1970 Connie Monks Conservative Feb 1974 George Rodgers Labour 1979 Den Dover Conservative 1997 Lindsay Hoyle Labour Elections
Elections in the 2010s
General Election 2010: Chorley[3] Party Candidate Votes % ±% Labour Lindsay Hoyle 21,515 43.2 -7.6 Conservative Alan Cullens 18,922 38.0 +3.6 Liberal Democrat Stephen J. Fenn 6,957 14.0 -0.7 UKIP Nick Hogan 2,021 4.1 +4.1 Independent Christopher P. Curtis 359 0.7 +0.7 Majority 2,593 5.2 -11.2 Turnout 49,774 70.2 +8.0 Labour hold Swing -5.6 Elections in the 2000s
General Election 2005: Chorley Party Candidate Votes % ±% Labour Lindsay Hoyle 25,131 50.7 -1.6 Conservative Simon Mallett 17,506 35.3 +0.6 Liberal Democrat Alexander Wilson-Fletcher 6,932 14.0 +2.8 Majority 7,625 15.4 -2.2 Turnout 49,569 62.9 +0.6 Labour hold Swing -1.1 General Election 2001: Chorley Party Candidate Votes % ±% Labour Lindsay Hoyle 25,088 52.3 -0.7 Conservative Peter Booth 16,644 34.7 -1.2 Liberal Democrat Stephen J. Fenn 5,372 11.2 +2.7 UKIP John Graeme Frost 848 1.8 +1.8 Majority 8,444 17.6 +0.5 Turnout 47,952 62.2 -15.3 Labour hold Swing +0.3 Elections in the 1990s
General Election 1997: Chorley Party Candidate Votes % ±% Labour Lindsay Hoyle 30,607 53.0 +12.0 Conservative Den Dover 20,737 35.9 −11.6 Liberal Democrat Simon Nicholas Jones 4,900 8.5 −3.0 Referendum Party Anthony Colin Heaton 1,319 2.3 +2.3 Natural Law Peter Douglas Napier Leadbetter 143 0.2 −0.4 Majority 9,870 17.1 +23.7 Turnout 57,706 77.3 −5.2 Labour gain from Conservative Swing +11.8 General Election 1992: Chorley[4] Party Candidate Votes % ±% Conservative Den Dover 30,715 47.2 −0.8 Labour Ray McManus 26,469 40.7 +6.0 Liberal Democrat Janet Ross-Mills 7,452 11.5 −4.6 Natural Law Peter Douglas Napier Leadbetter 402 0.6 +0.6 Majority 4,246 6.5 −6.8 Turnout 65,038 82.8 +5.9 Conservative hold Swing −3.4 Elections in the 1980s
General Election 1987: Chorley Party Candidate Votes % ±% Conservative Den Dover 29,015 48.0 -0.2 Labour Tony Watmough 20,958 34.7 +4.2 Liberal Ian Simpson 9,706 16.1 -4.2 Green Anthony Stephen Holgate 714 1.2 +0.4 Majority 8,057 13.3 -4.5 Turnout 60,393 76.9 -2.3 Conservative hold Swing -2.2 General Election 1983: Chorley Party Candidate Votes % ±% Conservative Den Dover 27,861 48.3 +1.5 Labour Ivan J. Taylor 17,586 30.5 -12.5 Social Democrat Peter D. O'Neill 11,691 20.2 +10.6 Ecology Anthony Stephen Holgate 451 0.8 +0.8 Independent Mrs Eva Rokas 114 0.2 +0.2 Majority 10,275 17.8 +13.9 Turnout 57,703 79.2 -2.8 Conservative hold Swing +7.0 Elections in the 1970s
General Election 1979: Chorley Party Candidate Votes % ±% Conservative Den Dover 31,125 46.8 +7.1 Labour George Rodgers 28,546 43.0 -1.1 Liberal Mrs Neva Orrell 6,388 9.6 -6.3 National Front Michael Dean 379 0.6 +0.6 Majority 2,579 3.9 +8.3 Turnout 66,438 82.0 +0.8 Conservative gain from Labour Swing +4.1 General Election October 1974: Chorley Party Candidate Votes % ±% Labour George Rodgers 27,290 44.1 +3.8 Conservative Barry Porter 24,577 39.7 0.0 Liberal Mrs Neva Orrell 9,831 15.9 -4.1 More Prosperous Britain Harold Smith 185 0.3 +0.3 Majority 2,713 4.4 +3.8 Turnout 61,883 81.2 -2.5 Labour hold Swing +1.9 General Election February 1974: Chorley Party Candidate Votes % ±% Labour George Rodgers 25,440 40.3 -4.0 Conservative Constance Monks 25,035 39.7 -7.5 Liberal Mrs Neva Orrell 12,652 20.0 +12.1 Majority 405 0.6 +3.6 Turnout 63,127 83.7 +4.9 Labour gain from Conservative Swing +1.75 General Election 1970: Chorley Party Candidate Votes % ±% Conservative Constance Monks 26,577 47.2 +2.0 Labour Derek A Forwood 24,900 44.3 -10.5 Liberal Gordon Payne 4,428 7.9 +7.9 Anti-Party Barry John Alwyn Elder 334 0.6 +0.6 Majority 1,677 3.0 +12.5 Turnout 56,239 78.8 -2.3 Conservative gain from Labour Swing +6.3 Elections in the 1960s
General Election 1966: Chorley Party Candidate Votes % ±% Labour Clifford Kenyon 27,319 54.8 +6.4 Conservative Constance Monks 22,575 45.2 +4.1 Majority 4,744 9.5 +2.2 Turnout 49,894 81.1 -3.5 Labour hold Swing +1.15 General Election 1964: Chorley Party Candidate Votes % ±% Labour Clifford Kenyon 24,710 48.4 -2.3 Conservative John Sutcliffe 20,997 41.1 -8.2 Liberal Alistair W. Bell 5,331 10.5 +10.5 Majority 3,713 7.3 +6.0 Turnout 51,038 84.6 -1.1 Labour hold Swing +3.0 Elections in the 1950s
General Election 1959: Chorley Party Candidate Votes % ±% Labour Clifford Kenyon 25,641 50.7 -0.7 Conservative Frank Taylor 24,965 49.3 +0.7 Majority 676 1.3 -1.5 Turnout 50,606 85.7 +1.4 Labour hold Swing -0.7 General Election 1955: Chorley Party Candidate Votes % ±% Labour Clifford Kenyon 24,994 51.4 +0.8 Conservative Alfred Hall-Davis 23,656 48.6 -0.8 Majority 1,338 2.8 +1.6 Turnout 48,650 84.3 +3.8 Labour hold Swing +0.8 General Election 1951: Chorley Party Candidate Votes % ±% Labour Clifford Kenyon 24,771 50.6 +3.0 Conservative Alfred Hall-Davis 24,118 49.4 +2.5 Majority 583 1.2 +0.5 Turnout 48,889 88.1 -0.3 Labour hold Swing +0.3 General Election 1950: Chorley Party Candidate Votes % ±% Labour Clifford Kenyon 23,233 47.6 -5.6 Conservative Andrew Fountaine 22,872 46.9 +0.1 Liberal F Adams 2,706 5.5 +5.5 Majority 361 0.7 -5.7 Turnout 46,105 88.4 +12.2 Labour hold Swing -2.9 Elections in the 1940s
General Election 1945: Chorley Party Candidate Votes % ±% Labour Clifford Kenyon 24,550 53.2 Conservative R H Brown 21,595 46.8 Majority 2,955 6.4 Turnout 46,145 76.2 Labour gain from Conservative Swing See also
Notes and references
- ^ "Electorate Figures - Boundary Commission for England". 2011 Electorate Figures. Boundary Commission for England. 4 March 2011. http://www.boundarycommissionforengland.org.uk/electoral-figures/electoral-figures.htm. Retrieved 13 March 2011.
- ^ Leigh Rayment's Historical List of MPs – Constituencies beginning with "C" (part 4)
- ^ BBC News, 7 May 2010
- ^ "UK General Election results April 1992". Richard Kimber's Political Science Resources. Politics Resources. 9 April 1992. http://www.politicsresources.net/area/uk/ge92/i05.htm. Retrieved 2010-12-06.
Sources
Categories:- Parliamentary constituencies in North West England
- United Kingdom Parliamentary constituencies established in 1885
- Politics of Chorley


Wikimedia Foundation. 2010.