- Mitcham and Morden (UK Parliament constituency)
-
Mitcham and Morden Borough constituency for the House of Commons 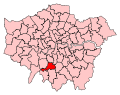
Boundary of Mitcham and Morden in Greater London.County Greater London Electorate 67,074 (December 2010)[1] Current constituency Created 1974 Member of Parliament Siobhain McDonagh (Labour) Number of members One Created from Mitcham
Merton & MordenOverlaps European Parliament constituency London Mitcham and Morden is a borough constituency represented in the House of Commons of the Parliament of the United Kingdom. It elects one Member of Parliament (MP) by the first-past-the-post system of election.
Contents
History
The constituency was created in 1974 from the former seats of Mitcham and Merton & Morden. Between 1974 and 1982 it was represented by Bruce Douglas-Mann who was elected as a Labour MP but defected in 1982 to the Social Democratic Party (SDP). On defecting he resigned his seat and sought re-election as an SDP MP, he was the only defector to have resigned his seat. In the subsequent By-Election held in May 1982 at the time of the Falklands War, the seat elected Angela Rumbold of the Conservative Party, this was the last time that any seat has been gained by a governing party in the UK. It was also the last time the Conservative Party would gain a seat at a by-election until 22 May 2008 when Edward Timpson took Crewe and Nantwich.
At the 1997 General Election the seat was won by Labour and Siobhain McDonagh was elected as Member of Parliament. At the 2001 General Election and the 2010 General Election, she was re-elected and her majority is 13,666 (31.2%).
Boundaries
Based within the London Borough of Merton, the constituency consists of the wards of Colliers Wood, Cricket Green, Figges Marsh, Graveney, Lavender Fields, Lower Morden, Longthornton, Pollards Hill, Ravensbury and St Helier.
The Boundary Commission recommondations, implemented at the 2010 election, were relatively minor with about 750 electors moving from Mitcham and Morden to Wimbledon and about 500 electors moving from Wimbledon to Mitcham and Morden. This has been caused by wards being aligned with constituency boundaries following the implementation of new ward boundaries for the London Borough of Merton at the 2002 Local Elections.
Constituency profile
The seat is broadly suburban, with terraced houses and low-rise estates in Tooting and Streatham at the Northern end of the seat. In the south-west of the constituency is most affluent part - Lower Morden.
In the middle, the former coaching stop of Mitcham with its ancient cricket green retains some village-like characteristics and has poor transport connections with the rest of London. In the 20th century, Mitcham became surrounded by modern council estates and light industry.
Recent years have seen growth in the ethnic minority population and it now makes up approximately one third of the population.[2]
Members of Parliament
Election Member [3] Party Feb 1974 Bruce Douglas-Mann Labour, then Independent SDP 1982 by-election Angela Rumbold Conservative 1997 Siobhain McDonagh Labour Election results
Elections in the 2010s
General Election 2010: Mitcham and Morden[4] Party Candidate Votes % ±% Labour Siobhain McDonagh 24,722 56.5 -0.3 Conservative Melanie Hampton 11,056 25.2 +0.6 Liberal Democrat Diana Coman 5,202 11.9 -2.1 BNP Tony Martin 1,386 3.2 N/A UKIP Andrew Mills 857 2.0 N/A Green Smarajit Roy 381 0.9 -2.6 Independent Rathy Alagaratnam 155 0.4 −0.1 Independent Ernest Redgrave 38 0.1 N/A Majority 13,666 31.2 −0.9 Turnout 43,797 67.0 +6.2 Labour hold Swing −0.4 Elections in the 2000s
General Election 2005: Mitcham and Morden Party Candidate Votes % ±% Labour Siobhain McDonagh 22,489 56.4 −4.0 Conservative Andrew Shellhorn 9,929 24.9 +0.8 Liberal Democrat Jo Christie-Smith 5,583 14.0 +3.9 Green Tom Walsh 1,395 3.5 +1.1 Veritas Adrian Roberts 286 0.7 N/A Independent Rathy Alagaratnam 186 0.5 N/A Majority 12,560 31.5 Turnout 39,868 61.2 +3.4 Labour hold Swing −2.4 General Election 2001: Mitcham and Morden Party Candidate Votes % ±% Labour Siobhain McDonagh 22,936 60.4 +2.1 Conservative Harry Stokes 9,151 24.1 −5.6 Liberal Democrat Nick Harris 3,820 10.1 +2.5 Green Tom Walsh 926 2.4 +1.6 BNP John Tyndall 642 1.7 +0.6 UKIP Adrian Roberts 486 1.3 +1.0 Majority 13,785 36.3 +7.6 Turnout 37,961 57.8 −15.5 Labour hold Swing Elections in the 1990s
General Election 1997: Mitcham and Morden[5][6] Party Candidate Votes % ±% Labour Siobhain McDonagh 27,984 58.4 +11.9 Conservative Angela Rumbold 14,243 29.7 −11.4 Liberal Democrat N Harris 3,632 7.6 −1.6 Referendum Party P Isaacs 810 1.7 N/A BNP Linda Miller 521 1.1 N/A Green T Walsh 415 0.9 −0.4 Independent K Vaikuntha Vasan 144 0.3 N/A UKIP J Barrett 117 0.2 N/A Independent N Dixon 80 0.2 N/A Majority 13,741 28.7 +25.3 Turnout 47,946 73.3 −7.0 Labour gain from Conservative Swing +15.6 General Election 1992: Mitcham and Morden[7] Party Candidate Votes % ±% Conservative Angela Rumbold 23,789 46.5 −1.7 Labour Siobhain McDonagh 22,055 43.1 +7.9 Liberal Democrat JC Field 4,687 9.2 −7.5 Green TJ Walsh 655 1.3 N/A Majority 1,734 3.4 −9.6 Turnout 51,186 80.3 +4.6 Conservative hold Swing -4.8 Elections in the 1980s
Merton, Mitcham and Morden by-election, 1982 Party Candidate Votes % ±% Conservative Angela Rumbold 13,306 43.4 -0.5 Social Democrat Bruce Douglas-Mann 9,032 29.4 N/A Labour David Nicholas 7,475 24.4 -20.8 National Front Joseph Pearce 547 1.8 -0.2 Independent Liberal Edward Larkin 123 0.4 N/A Ethnic Minority Candidate Roy Sawh 84 0.3 N/A Democratic Monarchist Bill Boaks 66 0.2 N/A COPS Jitendra Bardwaj 22 0.1 N/A Computer Democrat Christopher Farnsworth 18 0.0 N/A Majority 4,274 14.0 Turnout 48.5 Conservative gain from Labour Swing +10.2 References
- ^ "Electorate Figures - Boundary Commission for England". 2011 Electorate Figures. Boundary Commission for England. 4 March 2011. http://www.boundarycommissionforengland.org.uk/electoral-figures/electoral-figures.htm. Retrieved 13 March 2011.
- ^ http://ukpollingreport.co.uk/guide/seat-profiles/mitchamandmorden?cp=2
- ^ Leigh Rayment's Historical List of MPs – Constituencies beginning with "M" (part 3)
- ^ http://www.merton.gov.uk/council/voting/statementpersonsnominated2010m_m.pdf
- ^ "Politcs Resources". Election 1997. Politics Resources. 1 May 1997. http://www.politicsresources.net/area/uk/constit/059.htm. Retrieved 2010-12-25.
- ^ C. Rallings & M. Thrasher, The Media Guide to the New Parliamentary Constituencies, p.120 (Plymouth: LGC Elections Centre, 1995)
- ^ "Politics Resources". Election 1992. Politics Resources. 9 April 1992. http://www.politicsresources.net/area/uk/ge92/ge92index.htm. Retrieved 6 Dec 2010.
See also
Categories:- Parliamentary constituencies in London
- United Kingdom Parliamentary constituencies established in 1974
- Politics of Merton

Wikimedia Foundation. 2010.