- New Forest West (UK Parliament constituency)
-
Coordinates: 50°48′22″N 1°37′44″W / 50.806°N 1.629°W
New Forest West County constituency for the House of Commons 
Boundary of New Forest West in Hampshire.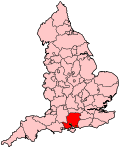
Location of Hampshire within England.County Hampshire Electorate 68,987 (December 2010)[1] Current constituency Created 1997 Member of Parliament Desmond Swayne (Conservative) Number of members One Created from New Forest Overlaps European Parliament constituency South East England New Forest West is a county constituency represented in the House of Commons of the Parliament of the United Kingdom. It elects one Member of Parliament (MP) by the first past the post system of election.
Contents
Boundaries
The constituency covers the part of the New Forest which is not covered by its other constituency, New Forest East. Settlements include Lymington, Fordingbridge, New Milton and Ringwood.
History
This constituency was created when the old New Forest constituency was divided for the 1997 general election.
Members of Parliament
Election Member [2] Party 1997 Desmond Swayne Conservative Elections
Elections in the 2010s
General Election 2010: New Forest West[3] Party Candidate Votes % ±% Conservative Desmond Swayne 27,980 58.8 +2.9 Liberal Democrat Mike Plummer 11,084 23.3 +4.1 Labour Janice Hurne 4,666 9.8 -6.7 UKIP Martin Lyon 2,783 5.9 +1.7 Green Janet Richards 1,059 2.2 *1.9 Majority 16,896 35.5 Turnout 47,572 69.6 +3.5 Conservative hold Swing -0.6 Elections in the 2000s
General Election 2005: New Forest West Party Candidate Votes % ±% Conservative Desmond Swayne 26,004 56.4 +0.7 Liberal Democrat Murari Kaushik 8,719 18.9 -6.9 Labour Janice Hurne 7,590 16.5 +1.8 UKIP Brian Lawrence 1,917 4.2 +0.5 Green Janet Richards 1,837 4.0 N/A Majority 17,285 37.5 +7.6 Turnout 46,067 66.5 +1.4 Conservative hold Swing +3.8 General Election 2001: New Forest West Party Candidate Votes % ±% Conservative Desmond Swayne 24,575 55.7 +5.1 Liberal Democrat Mike Bignell 11,384 25.8 -2.0 Labour Crada Onuegbu 6,481 14.7 +0.4 UKIP Michael Clark 1,647 3.7 +0.6 Majority 13,191 29.9 +7.1 Turnout 44,087 65.0 -9.7 Conservative hold Swing +3.6 Elections in the 1990s
General Election 1997: New Forest West Party Candidate Votes % ±% Conservative Desmond Swayne 25,149 50.6 N/A Liberal Democrat Bob Hale 13,817 27.8 N/A Labour Dave Griffiths 7,092 14.3 N/A Referendum Party Maureen Elliott 2,150 4.3 N/A UKIP Michael Holmes 1,542 3.1 N/A Majority 11,332 22.8 N/A Turnout 49,750 74.7 N/A Conservative hold Swing See also
Notes and references
- ^ "Electorate Figures - Boundary Commission for England". 2011 Electorate Figures. Boundary Commission for England. 4 March 2011. http://www.boundarycommissionforengland.org.uk/electoral-figures/electoral-figures.htm. Retrieved 13 March 2011.
- ^ Leigh Rayment's Historical List of MPs – Constituencies beginning with "N" (part 1)
- ^ "New Forest West". YourNextMP. http://www.yournextmp.com/seats/new_forest_west. Retrieved 6 April 2010.
Sources
- Election result, 2005 (BBC)
- Election results, 1997 - 2001 (BBC)
- Election results, 1997 - 2001 (Election Demon)
- Election results, 1997 - 2005 (Guardian)
Categories:- Parliamentary constituencies in Hampshire
- United Kingdom Parliamentary constituencies established in 1997
- New Forest (district)


Wikimedia Foundation. 2010.