- Crawley (UK Parliament constituency)
-
Coordinates: 51°06′47″N 0°10′59″W / 51.113°N 0.183°W
For other uses of "Crawley", see Crawley (disambiguation).Crawley Borough constituency for the House of Commons 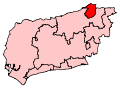
Boundary of Crawley in West Sussex.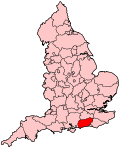
Location of West Sussex within England.County West Sussex Electorate 71,793 (December 2010)[1] Current constituency Created 1983 Member of Parliament Henry Smith (Conservative) Number of members One Created from Horsham and Crawley Overlaps European Parliament constituency South East England Crawley is a parliamentary constituency represented in the House of Commons of the Parliament of the United Kingdom. It elects one Member of Parliament (MP) by the first past the post system of election.
Contents
Boundaries
The constituency covers the whole of the town of Crawley in West Sussex, as well as London Gatwick Airport. Crawley borders Horsham to the East, South and West and Mole Valley and East Surrey to the North.
The Boundary Commission for England recommended that no changes to the constituency are made for the 2010 general election. The Crawley constituency continues to be co-terminous with the District boundaries.
History
Prior to the 1983 General Election, Crawley had been a part of the Horsham & Crawley, Horsham, and Horsham & Worthing constituencies at various times. Due to the growth of the Crawley as a new town in the 1960s and 70s, the Boundary Commission took the decision to separate it from Horsham in 1983. It looked safely Labour after comfortable victories in 1997 and 2001, but the sometimes volatile nature of New Town voters, especially in South-East England, has made the seat highly marginal again: Labour had a majority of 37 votes in the 2005 election, making this seat the most marginal in the UK. The 2010 election saw Henry Smith win the seat at the third attempt, beating Labour's Chris Oxlade by 5,928, with a swing of 6.3%.[2]
Members of Parliament
Election Member [3] Party 1983 Nicholas Soames Conservative 1997 Laura Moffatt Labour 2010 Henry Smith Conservative Elections
Elections in the 2010s
General Election 2010: Crawley[2] Party Candidate Votes % ±% Conservative Henry Smith 21,264 44.8 +5.8 Labour Chris Oxlade 15,336 32.3 −6.8 Liberal Democrat John Vincent 6,844 14.4 −1.1 BNP Richard Trower 1,672 3.5 +0.5 UKIP Chris French 1,382 2.9 +0.7 Green Phil Smith 598 1.3 N/A Justice Party Arshad Khan 265 0.6 +0.1 Independent Andrew Hubner 143 0.3 N/A Majority 5,928 12.5 +12.6 Turnout 47,504 65.3 +6.9 Conservative gain from Labour Swing +6.3 Elections in the 2000s
General Election 2005: Crawley Party Candidate Votes % ±% Labour Laura Moffatt 16,411 39.1 -10.2 Conservative Henry Smith 16,374 39.0 +6.8 Liberal Democrat Rupert Sheard 6,503 15.5 +2.8 BNP Richard Trower 1,277 3.0 N/A UKIP Ronald Walters 935 2.2 -0.7 Democratic Socialist Alliance - People Before Profit Robin Burnham 263 0.6 N/A Justice Party Arshad Khan 210 0.5 -0.2 Majority 37 0.1 Turnout 41,973 58.4 +3.2 Labour hold Swing -8.5 General Election 2001: Crawley Party Candidate Votes % ±% Labour Laura Moffatt 19,488 49.3 -5.7 Conservative Henry Smith 12,718 32.2 +0.4 Liberal Democrat Linda Seekings 5,009 12.7 +4.5 UKIP Brian Galloway 1,137 2.9 +2.2 Monster Raving Loony Claire Staniford 383 1.0 N/A Justice Party Arshad Khan 271 0.7 +0.2 Socialist Labour Karl Stewart 260 0.7 N/A Socialist Alliance Muriel Hirsch 251 0.6 N/A Majority 6,770 17.1 -6.2 Turnout 39,517 55.2 -17.7 Labour hold Swing -3.1 Elections in the 1990s
General Election 1997: Crawley Party Candidate Votes % ±% Labour Laura Moffatt 27,750 55.1 +14.7 Conservative Josephine Crabb 16,043 31.8 -12.1 Liberal Democrat Harold De Souza 4,141 8.2 -6.3 Referendum Party Ronald Walters 1,931 3.8 N/A UKIP Eric Saunders 322 0.6 N/A Justice Party Arshad Khan 230 0.5 N/A Majority 11,707 23.3 Turnout 50,417 72.9 Labour gain from Conservative Swing This constituency underwent boundary changes between the 1992 and 1997 general
elections and thus change in share of vote is based on a notional calculation.General Election 1992: Crawley[4] Party Candidate Votes % ±% Conservative Nicholas Soames 30,204 48.8 -0.7 Labour Laura Moffatt 22,439 36.2 +7.2 Liberal Democrat Gordon Seekings 8,558 13.8 -7.7 Green M. Wilson 766 1.2 N/A Majority 7,765 12.6 −7.9 Turnout 61,967 79.2 +2.1 Conservative hold Swing -4.0 Elections in the 1980s
General Election 1987: Crawley Party Candidate Votes % ±% Conservative Nicholas Soames 29,259 49.5 +1.4 Labour P. J. Leo 17,121 29.0 +2.8 Social Democrat D. N. Simmons 12,674 21.5 -4.2 Majority 12,138 20.5 Turnout 59,054 77.1 +0.7 Conservative hold Swing -0.7 General Election 1983: Crawley Party Candidate Votes % ±% Conservative Nicholas Soames 25,963 48.1 Labour Les Allen 14,149 26.2 Social Democrat T. Forrester 13,900 25.7 Majority 11,814 21.9 Turnout 54,012 76.4 Conservative hold Swing See also
Notes and references
- ^ "Electorate Figures - Boundary Commission for England". 2011 Electorate Figures. Boundary Commission for England. 4 March 2011. http://www.boundarycommissionforengland.org.uk/electoral-figures/electoral-figures.htm. Retrieved 13 March 2011.
- ^ a b BBC - Election 2010 - Crawley
- ^ Leigh Rayment's Historical List of MPs – Constituencies beginning with "C" (part 6)
- ^ "Politics Resources". Election 1992. Politics Resources. 9 April 1992. http://www.politicsresources.net/area/uk/ge92/ge92index.htm. Retrieved 2010-12-06.
Sources
- Election result, 2005 (BBC)
- Election results, 1997 - 2001 (BBC)
- Election results, 1997 - 2001 (Election Demon)
- Election results, 1983 - 1992 (Election Demon)
- Election results, 1992 - 2005 (Guardian)
Administration Constituency · Local Elections · MP: Henry Smith
Leisure Transport Crawley Station · Gatwick Airport Station · Ifield Station · Three Bridges Station · M23 motorway · A23 road · Metrobus · Fastway · Gatwick Airport
Education Buildings Listed buildings · Places of worship · Friary Church of St Francis and St Anthony · St John the Baptist's Church · St Margaret's Church · St Michael and All Angels Church · St Nicholas' Church · Ifield Friends Meeting House · Ancient Priors · Brewery Shades · Broadfield House · Charlwood House · City Place Gatwick · Crawley Hospital · George Hotel · Ifield Water Mill · Old Punch Bowl · The Beehive · Tree House · White Hart Inn
Geography Gatwick Stream · River Mole
Neighbourhoods
and other areasBewbush · Broadfield · Furnace Green · Gossops Green · Ifield · Langley Green · Lowfield Heath · Maidenbower · Manor Royal Industrial · Northgate · Pound Hill · Southgate · Three Bridges · Tilgate · Tinsley Green · West Green · Worth
Categories:- Parliamentary constituencies in South East England
- United Kingdom Parliamentary constituencies established in 1983
- Politics of West Sussex
- Crawley


Wikimedia Foundation. 2010.