- Mid Sussex (UK Parliament constituency)
-
Coordinates: 51°01′59″N 0°06′54″W / 51.033°N 0.115°W
Mid Sussex County constituency for the House of Commons 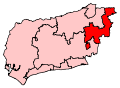
Boundary of Mid Sussex in West Sussex.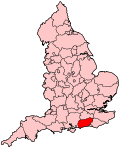
Location of West Sussex within England.County West Sussex Electorate 77,044 (December 2010)[1] Current constituency Created 1974 Member of Parliament Nicholas Soames (Conservative) Number of members One Created from East Grinstead and Lewes Overlaps European Parliament constituency South East England Mid Sussex is a parliamentary constituency represented in the House of Commons of the Parliament of the United Kingdom. It elects one Member of Parliament (MP) by the first past the post system of election. The current MP is Nicholas Soames of the Conservative Party, first elected for the constituency at the 1997 general election.
Contents
Boundaries
The constituency is located in the north east of West Sussex, bordering with East Sussex. It contains the towns of East Grinstead, Haywards Heath and Burgess Hill.
Boundary review
Following their review of parliamentary boundaries in West Sussex, the Boundary Commission for England has made alterations to all existing constituencies to deal with population changes. The modified Mid Sussex constituency is created with the following electoral wards:
- Ashurst Wood, Bolney, Burgess Hill, Cuckfield, East Grinstead, Haywards Heath , High Weald, and Lindfield.
History
The constituency was created in 1974 from parts of the seats of Lewes & East Grinstead, and has undergone significant boundary changes at every periodical review that it has been around for. Prior to 1983, the constituency had actually been a part of East Sussex, but as a result of the Local Government Act 1972, it was largely moved into West Sussex.
At the 1983 general election, it gained some of the wards previously contained in East Grinstead, and at the 1997 election, it gained many of the rural wards between East Grinstead and Crawley.
Members of Parliament
Election Member [2] Party Feb 1974 Tim Renton Conservative 1997 Nicholas Soames Conservative Elections
Elections in the 2010s
General Election 2010: Mid Sussex [3][4][5] Party Candidate Votes % ±% Conservative Nicholas Soames 28,329 50.7 +2.5 Liberal Democrat Serena Tierney 20,927 37.5 +1.8 Labour David Boot 3,689 6.6 -6.2 UKIP Marc Montgomery 1,423 2.5 -0.7 Green Paul Brown 645 1.2 +1.2 BNP Stuart Minihane 583 1.0 +1.0 Monster Raving Loony Baron von Thunderclap 259 0.5 +0.5 Majority 7, 402 13.3 Turnout 55,855 72.4 +3.5 Conservative hold Swing +0.3 Elections in the 2000s
General Election 2005: Mid Sussex Party Candidate Votes % ±% Conservative Nicholas Soames 23,765 48.0 +1.8 Liberal Democrat Serena Tierney 17,875 36.1 +5.0 Labour Robert Fromant 6,280 12.7 -6.3 UKIP Harold Piggott 1,574 3.2 +0.7 Majority 5,890 11.9 Turnout 49,494 68.6 3.7 Conservative hold Swing -1.6 General Election 2001: Mid Sussex Party Candidate Votes % ±% Conservative Nicholas Soames 21,150 46.2 +2.7 Liberal Democrat Lesley Wilkins 14,252 31.1 +0.5 Labour Paul Mitchell 8,693 19.0 +0.3 UKIP Petrina Holdsworth 1,126 2.5 +1.3 Monster Raving Loony Baron Von Thunderclap Berry 601 1.3 N/A Majority 6,898 15.1 Turnout 45,822 64.9 -12.7 Conservative hold Swing Elections in the 1990s
General Election 1997: Mid Sussex Party Candidate Votes % ±% Conservative Nicholas Soames 23,231 43.5 -15.5 Liberal Democrat Margaret Collins 16,377 30.6 +2.4 Labour Mervyn Hamilton 9,969 18.6 +8.0 Referendum Party Tam Large 3,146 5.9 N/A UKIP J V Barnett 606 1.1 N/A Independent Ernest Tudway 134 0.3 N/A Majority 6,854 12.8 Turnout 53,463 77.6 Conservative hold Swing This constituency underwent boundary changes between the 1992 and 1997 general elections and thus change in share of vote is based on a notional calculation.
General Election 1992: Mid Sussex[6] Party Candidate Votes % ±% Conservative Timothy Renton 39,524 59.0 -2.1 Liberal Democrat Margaret Collins 18,996 28.4 -3.1 Labour L C Gregory 6,951 10.4 +3.0 Green H G Stevens 772 1.1 N/A Monster Raving Loony P B Berry 392 0.6 N/A Independent P D Hodkin 246 0.4 N/A Natural Law Dr A M A Hankey 89 0.1 N/A Majority 20,528 30.6 +1.0 Turnout 66,970 82.9 Conservative hold Swing +5.7 Elections in the 1980s
General Election 1987: Mid Sussex Party Candidate Votes % ±% Conservative Timothy Renton 37,781 61.1 -0.3 Liberal N S E Westbrook 19,489 31.5 -0.8 Labour R S E Hughes 4,573 7.4 +1.4 Majority 18,292 29.6 Turnout 61,843 77.2 +2.5 Conservative hold Swing General Election 1983: Mid Sussex Party Candidate Votes % ±% Conservative Timothy Renton 35,310 61.4 Liberal J M Campbell 18,566 32.3 Labour P A Hawkes 3,470 6.0 Independent J Bray 196 0.3 Majority 16,744 29.1 Turnout 57,542 74.7 Conservative hold Swing This constituency underwent boundary changes between the 1979 and 1983 general elections and thus calculation of the change in share of vote is not possible.
Elections in the 1970s
General Election 1979: Mid Sussex Party Candidate Votes % ±% Conservative Timothy Renton 32,548 61.2 Liberal J M Campbell 11,705 22.0 Labour Des Turner 8,260 15.5 Independent Conservative S M H Haslett 697 1.3 Majority 20,843 39.2 Turnout 53,210 78.0 Conservative hold Swing General Election October 1974: Mid Sussex Party Candidate Votes % ±% Conservative Timothy Renton 25,126 53.9 Liberal R A Symes-Schutzman 13,129 28.1 Labour M R Fraser 8,404 18.0 Majority 11,997 25.7 Turnout 46,659 76.4 Conservative hold Swing General Election February 1974: Mid Sussex Party Candidate Votes % ±% Conservative Timothy Renton 27,317 54.1 Liberal R A Symes-Schutzman 15,162 30.0 Labour M R Fraser 7,993 15.8 Majority 12,155 24.1 Turnout 50,472 83.3 Conservative hold Swing See also
Notes and references
- ^ "Electorate Figures - Boundary Commission for England". 2011 Electorate Figures. Boundary Commission for England. 4 March 2011. http://www.boundarycommissionforengland.org.uk/electoral-figures/electoral-figures.htm. Retrieved 13 March 2011.
- ^ Leigh Rayment's Historical List of MPs – Constituencies beginning with "S" (part 6)
- ^ Mid Sussex
- ^ "Official Monster Raving Loony Party". http://www.omrlp.com/. Retrieved 30 December 2009.
- ^ "BBC News Election 2010 Constituency Sussex Mid". http://news.bbc.co.uk/nol/shared/election2010/results/constituency/c90.stm/. Retrieved 07 May 2010.[dead link]
- ^ "Politics Resources". Election 1992. Politics Resources. 9 April 1992. http://www.politicsresources.net/area/uk/ge92/ge92index.htm. Retrieved 6 Dec 2010.
Sources
- Election result, 2005 (BBC)
- Election results, 1997 - 2001 (BBC)
- Election results, 1997 - 2001 (Election Demon)
- Election results, 1983 - 1997 (Election Demon)
- Election results, 1992 - 2005 (Guardian)
- Election results, 1974 - 2001 (Keele University)
Categories:- Parliamentary constituencies in South East England
- United Kingdom Parliamentary constituencies established in 1974
- Politics of West Sussex
- Politics of East Sussex
- Mid Sussex


Wikimedia Foundation. 2010.