- Cheltenham Council election, 2010
-
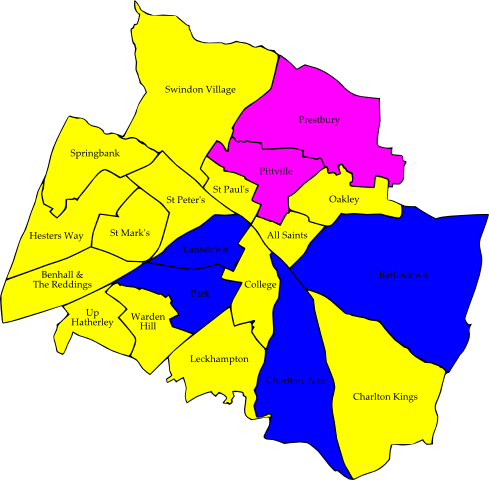
 Map of the results of the 2010 Cheltenham council election. Liberal Democrat in yellow, Conservatives in blue and People Against Bureaucracy in pink.
The 2010 Cheltenham Council election took place on 6 May 2010 to elect members of Cheltenham Borough Council in Gloucestershire, England. Half of the council was up for election and the Liberal Democrats stayed in overall control of the council.[1]
After the election, the composition of the council was
- Liberal Democrat 25
- Conservative 12
- People Against Bureaucracy 3[2]
Contents
Candidates
In total 64 candidates stood in the election for the 22 seats that were being contested.[3] Among those defending seats were 2 Liberal Democrat cabinet members, the Conservative group leader Stuart Hutton and 2 People Against Bureaucracy councillors.[3] Other candidates included 12 from the Green Party, a record high for the party in Cheltenham.[3]
Election result
The results saw the Liberal Democrats increase their majority on the council after gaining 4 seats from the Conservatives.[4] Among the Conservative defeats to the Liberal Democrats was the Conservative group leader Stuart Hutton in Warden Hill ward[5] and Conservative councillor David Hall who was defeated in Up Hatherley by 1 vote.[6] The Liberal Democrat gains meant they held 25 seats after the election, as against 12 for the Conservatives and 3 People Against Bureaucracy councillors.[4]
Cheltenham Borough Council Election Result 2010[7][2] Party Seats Gains Losses Net gain/loss Seats % Votes % Votes +/- Liberal Democrat 16 4 0 +4 72.7 51.1 32,084 +6.2% Conservative 4 0 4 -4 18.2 38.5 24,142 -7.3% People Against Bureaucracy Group 2 0 0 0 9.1 4.4 2,769 -1.3% Green 0 0 0 0 0 3.6 2,278 +2.9% Labour 0 0 0 0 0 2.3 1,456 -0.6% Ward results
All Saints[7][6] Party Candidate Votes % ±% Liberal Democrat Charles Stewart 1,420 52.4 -6.7 Conservative Peter Christensen 937 34.6 +1.0 Labour Diana Hale 190 7.0 +4.1 Green Ian Lander 164 6.0 +1.6 Majority 483 17.8 -7.7 Turnout 2,711 63.8 +31.9 Liberal Democrat hold Swing Battledown[7][6] Party Candidate Votes % ±% Conservative Paul McLain 1,563 52.1 -14.6 Liberal Democrat Paul McCloskey 1,438 47.9 +18.8 Majority 125 4.2 -33.4 Turnout 3,001 73.6 +32.2 Conservative hold Swing Benhall & The Reddings[7][6] Party Candidate Votes % ±% Liberal Democrat Nigel Britter 1,701 54.9 +5.6 Conservative Chris Mason 1,241 40.1 -10.6 Green Birgit Whitman 155 5.0 +5.0 Majority 460 14.9 Turnout 3,097 75.9 +29.8 Liberal Democrat hold Swing Charlton Kings[7][6] Party Candidate Votes % ±% Liberal Democrat Helena McCloskey 1,611 47.8 +0.4 Conservative Chris Ryder 1,537 45.6 -3.4 Green Sarah Field 222 6.6 +6.6 Majority 74 2.2 Turnout 3,370 78.6 +32.6 Liberal Democrat gain from Conservative Swing Charlton Park[7][6] Party Candidate Votes % ±% Conservative Penny Hall 1,641 52.0 -15.9 Liberal Democrat Paul Baker 1,512 48.0 +15.9 Majority 129 4.1 -31.7 Turnout 3,153 78.3 +31.3 Conservative hold Swing College[7][6] Party Candidate Votes % ±% Liberal Democrat Garth Barnes 1,664 54.3 -4.7 Conservative Charlie Perkins 1,175 38.4 -2.6 Green Victoria Angelo-Thomson 223 7.3 +7.3 Majority 489 16.0 -2.1 Turnout 3,062 70.2 +30.7 Liberal Democrat hold Swing Hesters Way[7][6] Party Candidate Votes % ±% Liberal Democrat Simon Wheeler 1,767 68.1 +3.0 Conservative Richard East 829 31.9 +2.6 Majority 938 36.1 +0.3 Turnout 2,596 51.8 +27.5 Liberal Democrat hold Swing Lansdown[7][6] Party Candidate Votes % ±% Conservative Barbara Driver 1,361 49.5 -9.8 Liberal Democrat Leone Meyer 1,186 43.1 +9.6 Green John Heywood 205 7.4 +7.4 Majority 175 6.4 -19.5 Turnout 2,752 60.2 +32.0 Conservative hold Swing Leckhampton[7][6] Party Candidate Votes % ±% Liberal Democrat Ian Bickerton 1,639 48.8 +4.8 Conservative Tim Harman 1,506 44.8 -11.2 Green Timothy Bonsor 216 6.4 +6.4 Majority 133 4.0 Turnout 3,361 81.4 +28.5 Liberal Democrat gain from Conservative Swing Oakley (2)[7][6] Party Candidate Votes % ±% Liberal Democrat Colin Hay 1,174 Liberal Democrat Rowena Hay 1,066 Conservative Mireille Weller 646 Conservative Nathan Weller 583 Labour Brian Hughes 294 Labour Clive Harriss 282 Turnout 4,045 53.5 +23.4 Liberal Democrat hold Swing Liberal Democrat hold Swing Park[7][6] Party Candidate Votes % ±% Conservative Rob Garnham 1,917 51.0 -16.7 Liberal Democrat Alexis Cassin 1,585 42.2 +9.9 Green Jon Stubbings 257 6.8 +6.8 Majority 332 8.8 -26.6 Turnout 3,759 71.9 +35.1 Conservative hold Swing Pittville[7][6] Party Candidate Votes % ±% People Against Bureaucracy Group Diane Hibbert 971 32.9 +13.2 Liberal Democrat John Oates 966 32.7 -0.8 Conservative Geraldine Beaty 863 29.2 -9.5 Green Cathy Green 151 5.1 +1.1 Majority 5 0.2 Turnout 2,951 69.0 +31.3 Independent hold Swing Prestbury[7][6] Party Candidate Votes % ±% People Against Bureaucracy Group Les Godwin 1,798 53.0 -2.1 Conservative Terence Derry 842 24.8 -2.2 Liberal Democrat Heiman Chan 754 22.2 +9.5 Majority 956 28.2 +0.2 Turnout 3,394 73.5 +31.8 Independent hold Swing Springbank (2)[7][6] Party Candidate Votes % ±% Liberal Democrat Peter Jeffries 1,688 Liberal Democrat John Morris 1,626 Conservative Helen Smith 746 Conservative Leon Mekitarian 729 Turnout 4,789 54.3 +31.2 Liberal Democrat hold Swing Liberal Democrat hold Swing St. Mark's[7][6] Party Candidate Votes % ±% Liberal Democrat Sandra Holliday 1,517 55.3 +5.0 Conservative Michael Bourne 804 29.3 -4.9 Labour Rod Gay 290 10.6 +1.9 Green Sherri Williams 131 4.8 -1.9 Majority 713 26.0 -0.4 Turnout 2,742 58.9 +32.5 Liberal Democrat hold Swing St. Paul's[7][6] Party Candidate Votes % ±% Liberal Democrat Jon Walklett 1,347 64.9 -0.8 Conservative Greg Patton 518 25.0 -9.3 Green Adrian Becker 210 10.1 +10.1 Majority 829 40.0 +8.5 Turnout 2,075 44.1 +28.1 Liberal Democrat hold Swing St. Peter's[7][6] Party Candidate Votes % ±% Liberal Democrat Pat Thornton 1,685 60.1 +2.2 Conservative Emma Logan 847 30.2 -4.9 Labour Robert Irons 271 9.7 +2.7 Majority 838 29.9 +7.1 Turnout 2,803 54.5 +28.5 Liberal Democrat hold Swing Swindon Village[7][6] Party Candidate Votes % ±% Liberal Democrat Paul Massey 1,728 65.1 +7.7 Conservative John Hardman 925 34.9 +16.4 Majority 803 30.3 -3.0 Turnout 2,653 59.0 +25.6 Liberal Democrat hold Swing Up Hatherley[7][6] Party Candidate Votes % ±% Liberal Democrat Andrew McKinlay 1,470 46.0 -12.4 Conservative David Hall 1,469 46.0 +4.4 Labour Neville Mozley 129 4.0 +4.0 Green Matthew Hodgkinson 125 3.9 +3.9 Majority 1 0.0 -16.9 Turnout 3,193 76.6 +31.6 Liberal Democrat gain from Conservative Swing Warden Hill[7][6] Party Candidate Votes % ±% Liberal Democrat Josephine Teakle 1,540 47.8 +17.9 Conservative Stuart Hutton 1,463 45.4 -24.7 Green Adam Van Coevorden 219 6.8 +6.8 Majority 77 2.4 Turnout 3,222 73.1 +33.4 Liberal Democrat gain from Conservative Swing References
- ^ "Cheltenham". BBC News Online. 2009-04-19. http://news.bbc.co.uk/1/shared/election2010/council/html/3672.stm. Retrieved 2010-10-25.
- ^ a b "Local elections 2010". London: guardian.co.uk. 2010-05-07. http://www.guardian.co.uk/society/table/2010/may/07/local-elections. Retrieved 2010-10-25.
- ^ a b c "Baker to battle for council seat". Gloucestershire Echo. 2010-04-13. http://www.newsuk.co.uk/newsuk/advancedSearchDisplayRecord.do?SortType=reverseChronological&PageSize=25&ItemNumber=107&QueryType=quickSearch. Retrieved 2010-10-25.
- ^ a b Dryden, Fiona (2010-05-10). "Liberals plan fresh future for our town". Gloucestershire Echo. p. 13.
- ^ "Lib Dems take control of Cheltenham Borough Council". BBC News Online. 2010-05-07. http://news.bbc.co.uk/1/hi/uk_politics/election_2010/8669346.stm. Retrieved 2010-10-25.
- ^ a b c d e f g h i j k l m n o p q r s t u "Cheltenham Borough Council local election results". this is Gloucestershire. 2010-05-07. http://www.thisisgloucestershire.co.uk/news/Cheltenham-Borough-Council-local-election-results/article-2130732-detail/article.html. Retrieved 2010-10-25.
- ^ a b c d e f g h i j k l m n o p q r s t u "Borough Council elections 6th May 2010". Cheltenham Borough Council. http://www.cheltenham.gov.uk/downloads/Borough_2010.pdf. Retrieved 2010-10-25.
Preceded by
Cheltenham Council election, 2008Cheltenham local elections Succeeded by
Cheltenham Council election, 2012(2009 ←) United Kingdom local elections, 2010 (→ 2011) London boroughs Barking and Dagenham · Barnet · Bexley · Brent · Bromley · Camden · Croydon · Ealing · Enfield · Greenwich · Hackney · Hammersmith and Fulham · Haringey · Harrow · Havering · Hillingdon · Hounslow · Islington · Kensington and Chelsea · Kingston upon Thames · Lambeth · Lewisham · Merton · Newham · Redbridge · Richmond upon Thames · Southwark · Sutton · Tower Hamlets · Waltham Forest · Wandsworth · WestminsterMetropolitan boroughs Barnsley · Birmingham · Bolton · Bradford · Bury · Calderdale · Coventry · Doncaster · Dudley · Gateshead · Kirklees · Knowsley · Leeds · Liverpool · Manchester · Newcastle upon Tyne · North Tyneside · Oldham · Rochdale · Rotherham · Salford · Sandwell · Sefton · Sheffield · Solihull · South Tyneside · St Helens · Stockport · Sunderland · Tameside · Trafford · Wakefield · Walsall · Wigan · Wirral · Wolverhampton
Unitary authorities Blackburn with Darwen · Bristol · Derby · Halton · Hartlepool · Kingston upon Hull · Milton Keynes · North East Lincolnshire · Peterborough · Plymouth · Portsmouth · Reading · Slough · Southampton · Southend-on-Sea · Stoke-on-Trent · Swindon · Thurrock · Warrington · WokinghamDistrict councils Adur · Amber Valley · Barrow-in-Furness · Basildon · Basingstoke and Deane · Bassetlaw · Brentwood · Broxbourne · Burnley · Cambridge · Cannock Chase · Carlisle · Castle Point · Cheltenham · Cherwell · Chorley · Colchester · Craven · Crawley · Daventry · Eastleigh · Elmbridge · Epping Forest · Fareham · Gloucester · Gosport · Great Yarmouth · Harlow · Harrogate · Hart · Hastings · Havant · Hertsmere · Huntingdonshire · Hyndburn · Ipswich · Lincoln · Maidstone · Mole Valley · Newcastle-under-Lyme · North Hertfordshire · Nuneaton and Bedworth · Oxford · Pendle · Preston · Purbeck · Redditch · Reigate and Banstead · Rochford · Rossendale · Rugby · Runnymede · Rushmoor · South Cambridgeshire · South Lakeland · St Albans · Stevenage · Stratford-on-Avon · Stroud · Swale · Tamworth · Tandridge · Three Rivers · Tunbridge Wells · Watford · Waveney · Welwyn Hatfield · West Lancashire · West Lindsey · West Oxfordshire · Weymouth and Portland · Winchester · Woking · Worcester · Worthing · Wyre ForestCategories:- Council elections in South West England
- English local elections, 2010
- Politics of Cheltenham
- English District Council elections
Wikimedia Foundation. 2010.