- Maidstone Council election, 2010
-
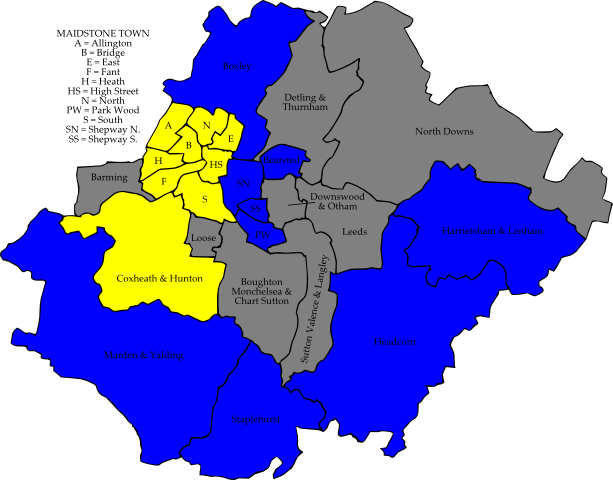
 Map of the results of the 2010 Maidstone council election. Conservatives in blue and Liberal Democrats in yellow. Wards in grey were not contested in 2010.
The 2010 Maidstone Council election took place on 6 May 2010 to elect members of Maidstone Borough Council in Kent, England. One third of the council was up for election and the Conservative party stayed in overall control of the council.[1]
After the election, the composition of the council was
- Conservative 28
- Liberal Democrat 23
- Independent 4[2]
Election result
The results saw the Conservatives hold control of the council after winning half of the seats being elected.[3] This meant the Conservatives remained on 28 seats, while the Liberal Democrats gained 2 to hold 23 seats.[3][4] Meanwhile 2 independents lost seats, meaning there were 4 independents on the council after the election.[4] Overall turnout in the election was 66%.[5]
The Liberal Democrats gained 3 seats from the Conservatives in the wards of Bridge, East and South, including defeating the cabinet member for leisure and Conservative deputy leader, Brian Moss, in Bridge.[4] However the Conservatives took a seat back from the Liberal Democrats in Park Wood and the Conservatives also gained 2 seats from independents.[4] The Conservatives gains from independents came in Bearsted and Shepway South, with the independent group leader, Pat Marshall, losing in Bearsted.[4]
Maidstone Local Election Result 2010[6][2] Party Seats Gains Losses Net gain/loss Seats % Votes % Votes +/- Conservative 9 3 3 0 50.0 43.5 28,266 -6.2% Liberal Democrat 9 3 1 +2 50.0 36.0 23,390 +3.3% Independent 0 0 2 -2 0 5.7 3,710 +1.7% Labour 0 0 0 0 0 9.5 6,182 +2.8% Green 0 0 0 0 0 3.9 2,540 -2.1% UKIP 0 0 0 0 0 1.2 762 +0.4% National Front 0 0 0 0 0 0.2 146 +0.2% Ward results
Allington[6] Party Candidate Votes % ±% Liberal Democrat Dan Doley 2,705 63.3 +3.7 Conservative Andrew Lehegarat 1,178 27.6 -2.4 Labour Marianna Poliszczuk 292 6.8 +2.3 Green Rebecca Matthews 100 2.3 -0.1 Majority 1,527 35.7 +6.1 Turnout 4,275 Liberal Democrat hold Swing Bearsted[6] Party Candidate Votes % ±% Conservative Heather Langley 2,546 50.4 -24.3 Independent Pat Marshall 1,768 35.0 +35.0 Labour Jim Grogan 539 10.7 +10.7 Green Ciaran Oliver 196 3.9 -2.9 Majority 778 15.4 -40.7 Turnout 5,049 Conservative gain from Independent Swing Boxley[6] Party Candidate Votes % ±% Conservative Derek Butler 2,796 60.2 -18.6 Liberal Democrat John Watson 1,064 22.9 +7.2 Labour Steve Gibson 618 13.3 +13.3 Green John Aust 165 3.6 -2.1 Majority 1,732 37.3 -25.8 Turnout 4,643 Conservative hold Swing Bridge[6] Party Candidate Votes % ±% Liberal Democrat David Pickett 1,345 46.2 +3.5 Conservative Brian Moss 1,181 40.6 -4.2 Labour Bruce Heald 269 9.2 +2.5 Green Robin Kinrade 117 4.0 -1.9 Majority 164 5.6 Turnout 2,912 Liberal Democrat gain from Conservative Swing Coxheath and Hunton[6] Party Candidate Votes % ±% Liberal Democrat Brian Mortimer 2,394 58.1 +12.7 Conservative Simon Elliott 1,480 35.9 -15.0 UKIP Keith Woolven 162 3.9 +3.9 Green Andrew Waldie 85 2.1 +2.1 Majority 914 22.2 Turnout 4,121 Liberal Democrat hold Swing East[6] Party Candidate Votes % ±% Liberal Democrat Jane Naghi 2,324 52.8 -3.9 Conservative Scott Hahnefeld 1,458 33.1 -4.3 Labour Patrick Coates 280 6.4 +6.4 UKIP Gareth Kendall 225 5.1 +5.1 Green Sandra McDowell 116 2.6 -3.3 Majority 866 19.7 Turnout 4,403 Liberal Democrat gain from Conservative Swing Fant[6] Party Candidate Votes % ±% Liberal Democrat Steve Beerling 1,704 43.6 +16.0 Conservative James Cook 1,344 34.4 +1.1 Green Stuart Jeffery 480 12.3 -3.7 Labour Keith Adkinson 382 9.8 -13.3 Majority 360 9.2 Turnout 3,910 Liberal Democrat hold Swing Harrietsham and Lenham[6] Party Candidate Votes % ±% Conservative John Barned 1,451 46.4 +5.8 Independent Janetta Sams 1,394 44.6 -1.2 Labour Gill Annan 280 9.0 +9.0 Majority 57 1.8 Turnout 3,125 Conservative hold Swing Headcorn[6] Party Candidate Votes % ±% Conservative Jenny Gibson 1,922 67.3 +0.6 Liberal Democrat Geoffrey Samme 395 13.8 +13.8 Green Penny Kemp 292 10.2 -23.1 Labour Christine Edwards-Daem 245 8.6 +8.6 Majority 1,527 53.5 +20.1 Turnout 2,854 Conservative hold Swing Heath[6] Party Candidate Votes % ±% Liberal Democrat Jenni Sharp 1,114 41.2 -4.2 Conservative Nick de Wiggondene 1,035 38.3 -3.5 Labour Wendy Hollands 296 10.9 +4.2 Independent Carol Vizzard 172 6.4 +6.4 Green Hannah Patton 87 3.2 -2.9 Majority 79 2.9 -0.7 Turnout 2,704 Liberal Democrat hold Swing High Street[6] Party Candidate Votes % ±% Liberal Democrat Clive English 1,793 51.5 +7.6 Conservative Paul Butcher 1,085 31.2 -5.1 Labour Richard Coates 314 9.0 +0.0 UKIP Frank Stanford 181 5.2 -0.3 Green Wendy Lewis 110 3.2 -2.1 Majority 708 20.3 +12.7 Turnout 3,483 Liberal Democrat hold Swing Marden and Yalding[6] Party Candidate Votes % ±% Conservative Rodd Nelson-Gracie 2,395 58.3 -14.6 Liberal Democrat Carol Jacques 1,215 29.6 +14.1 Labour Edith Davis 335 8.2 -3.4 Green James Shalice 164 4.0 +4.0 Majority 1,180 28.7 -28.7 Turnout 4,109 Conservative hold Swing North[6] Party Candidate Votes % ±% Liberal Democrat Tony Harwood 1,978 52.1 -7.3 Conservative Jeff Tree 1,225 32.2 -0.2 Labour Sally Wilcox 299 7.9 +7.9 UKIP Charles Elliott 194 5.1 +5.1 Green Derek Eagle 104 2.7 -5.6 Majority 753 19.8 -7.2 Turnout 3,800 Liberal Democrat hold Swing Park Wood[6] Party Candidate Votes % ±% Conservative David Burton 790 39.8 +8.6 Liberal Democrat Daniel Moriarty 715 36.0 -18.1 Labour Mick Beckwith 356 17.9 +3.1 Independent Stella Stevens 77 3.9 +3.9 Green Joan Langrick 48 2.4 +2.4 Majority 75 3.8 Turnout 1,986 Conservative gain from Liberal Democrat Swing Shepway North[6] Party Candidate Votes % ±% Conservative Mike Yates 1,651 45.0 -15.6 Liberal Democrat Joseph Mullen 851 23.2 +11.0 Labour Geoff Harvey 754 20.6 -0.2 National Front Gary Butler 146 4.0 +4.0 Green Ainsley Francis 133 3.6 -3.7 Independent Jon Hicks 132 3.6 -2.7 Majority 800 21.8 -18.0 Turnout 3,667 Conservative hold Swing Shepway South[6] Party Candidate Votes % ±% Conservative Adrian Brindle 928 39.1 -12.8 Liberal Democrat Ken Stevens 649 27.3 +11.2 Labour Peter Edwards-Daem 632 26.6 -5.4 Independent Sheena Williams 167 7.0 +7.0 Majority 279 11.7 -8.2 Turnout 2,376 Conservative gain from Independent Swing South[6] Party Candidate Votes % ±% Liberal Democrat Derek Mortimer 2,062 47.0 -1.2 Conservative Alan Chell 1,895 43.2 -4.4 Labour John Morgan 291 6.6 +2.4 Green Daniel Broad 141 3.2 +3.2 Majority 167 3.8 +3.1 Turnout 4,389 Liberal Democrat gain from Conservative Swing Staplehurst[6] Party Candidate Votes % ±% Conservative Eric Hotson 1,906 59.7 -10.4 Liberal Democrat Steven Williams 1,082 33.9 +17.1 Green Ian McDonald 202 6.3 +6.3 Majority 824 25.8 -27.5 Turnout 3,190 Conservative hold Swing References
- ^ "Maidstone". BBC News Online. 19 April 2009. http://news.bbc.co.uk/1/shared/election2010/council/html/3716.stm. Retrieved 10 March 2011.
- ^ a b "Local elections 2010". London: guardian.co.uk. 2010-05-07. http://www.guardian.co.uk/society/table/2010/may/07/local-elections. Retrieved 2011-03-11.
- ^ a b "Conservatives hold local councils in Kent". BBC News Online. 7 May 2010. http://news.bbc.co.uk/1/hi/uk_politics/election_2010/england/8668554.stm. Retrieved 11 March 2011.
- ^ a b c d e "Tories keep control of Maidstone but lose a senior councillor". Kent Messenger. http://www.kentonline.co.uk/kent_messenger/news/2010/may/7/tories_keep_control_of_maidsto.aspx. Retrieved 11 March 2011.
- ^ "Elections - results". Maidstone Borough Council. http://www.maidstone.gov.uk/council_and_democracy/councillors,_democracy_and_ele/elections_-_results.aspx. Retrieved 11 March 2011.
- ^ a b c d e f g h i j k l m n o p q r s "Maidstone". Local Elections Archive Project. http://www.andrewteale.me.uk/leap/results/2010/241/. Retrieved 10 March 2011.
Preceded by
Maidstone Council election, 2008Maidstone local elections Succeeded by
Maidstone Council election, 2011(2009 ←) United Kingdom local elections, 2010 (→ 2011) London boroughs Barking and Dagenham · Barnet · Bexley · Brent · Bromley · Camden · Croydon · Ealing · Enfield · Greenwich · Hackney · Hammersmith and Fulham · Haringey · Harrow · Havering · Hillingdon · Hounslow · Islington · Kensington and Chelsea · Kingston upon Thames · Lambeth · Lewisham · Merton · Newham · Redbridge · Richmond upon Thames · Southwark · Sutton · Tower Hamlets · Waltham Forest · Wandsworth · WestminsterMetropolitan boroughs Barnsley · Birmingham · Bolton · Bradford · Bury · Calderdale · Coventry · Doncaster · Dudley · Gateshead · Kirklees · Knowsley · Leeds · Liverpool · Manchester · Newcastle upon Tyne · North Tyneside · Oldham · Rochdale · Rotherham · Salford · Sandwell · Sefton · Sheffield · Solihull · South Tyneside · St Helens · Stockport · Sunderland · Tameside · Trafford · Wakefield · Walsall · Wigan · Wirral · Wolverhampton
Unitary authorities Blackburn with Darwen · Bristol · Derby · Halton · Hartlepool · Kingston upon Hull · Milton Keynes · North East Lincolnshire · Peterborough · Plymouth · Portsmouth · Reading · Slough · Southampton · Southend-on-Sea · Stoke-on-Trent · Swindon · Thurrock · Warrington · WokinghamDistrict councils Adur · Amber Valley · Barrow-in-Furness · Basildon · Basingstoke and Deane · Bassetlaw · Brentwood · Broxbourne · Burnley · Cambridge · Cannock Chase · Carlisle · Castle Point · Cheltenham · Cherwell · Chorley · Colchester · Craven · Crawley · Daventry · Eastleigh · Elmbridge · Epping Forest · Fareham · Gloucester · Gosport · Great Yarmouth · Harlow · Harrogate · Hart · Hastings · Havant · Hertsmere · Huntingdonshire · Hyndburn · Ipswich · Lincoln · Maidstone · Mole Valley · Newcastle-under-Lyme · North Hertfordshire · Nuneaton and Bedworth · Oxford · Pendle · Preston · Purbeck · Redditch · Reigate and Banstead · Rochford · Rossendale · Rugby · Runnymede · Rushmoor · South Cambridgeshire · South Lakeland · St Albans · Stevenage · Stratford-on-Avon · Stroud · Swale · Tamworth · Tandridge · Three Rivers · Tunbridge Wells · Watford · Waveney · Welwyn Hatfield · West Lancashire · West Lindsey · West Oxfordshire · Weymouth and Portland · Winchester · Woking · Worcester · Worthing · Wyre ForestCategories:- English local elections, 2010
- Council elections in Kent
- English District Council elections
- Maidstone (borough)
Wikimedia Foundation. 2010.