- Cost of electricity by source
-
The cost of electricity generated by different sources measures the cost of generating electricity including initial capital, return on investment, as well as the costs of continuous operation, fuel, and maintenance. The price is normally measured in units of local currency per unit of electricity, for example cents-per-kilowatt-hour for small numbers, or dollars-per-megawatt-hour for larger quantities.
Contents
Cost factors
While calculating costs, several internal cost factors have to be considered.[1] (Note the use of "costs," which is not the actual selling price, since this can be affected by a variety of factors such as subsidies on some energy and sources and taxes on others):
- Capital costs (including waste disposal and decommissioning costs for nuclear energy) - tend to be low for fossil fuel power stations; high for wind turbines, solar PV and nuclear; very high for waste to energy, wave and tidal, solar thermal.[citation needed]
- Fuel costs - high for fossil fuel and biomass sources, very low for nuclear and renewables.[citation needed]
- Factors such as the costs of waste (and associated issues) and different insurance costs are not included in the following: Works power, own use or parasitic load - i.e. the portion of generated power actually used to run the stations pumps and fans has to be allowed for.[citation needed]
To evaluate the total cost of production of electricity, the streams of costs are converted to a net present value using the time value of money. These costs are all brought together using discounted cash flow here.[2] and here.[3]
Another collection of cost calculations is shown here:,[4] here,[5] and,[6] and.[7]
BP claims renewables are on a decreasing cost curve - solar PV even more than wind turbines, while non-renewables are on an increasing cost curve[8], however the UK Energy Resource Centre found that the cost of building an offshore wind farm has doubled between 2003 and 2008.[9]
Calculations
Levelised energy cost (LEC, also commonly abbreviated as LCOE [10]) is the price at which electricity must be generated from a specific source to break even. It is an economic assessment of the cost of the energy-generating system including all the costs over its lifetime: initial investment, operations and maintenance, cost of fuel, cost of capital, and is very useful in calculating the costs of generation from different sources.[citation needed]
It can be defined in a single formula as:[11]

where
- LEC = Average lifetime levelised electricity generation cost
- It = Investment expenditures in the year t
- Mt = Operations and maintenance expenditures in the year t
- Ft = Fuel expenditures in the year t
- Et = Electricity generation in the year t
- r = Discount rate
- n = Life of the system
Typically LECs are calculated over 20 to 40 year lifetimes, and are given in the units of currency per kilowatt-hour, for example AUD/kWh or EUR/kWh or per megawatt-hour, for example AUD/MWh (as tabulated below).[citation needed]
System boundaries
When comparing LECs for alternative systems, it is very important to define the boundaries of the 'system' and the costs that are included in it. For example, should transmissions lines and distribution systems be included in the cost? Typically only the costs of connecting the generating source into the transmission system is included as a cost of the generator. But in some cases wholesale upgrade of the Grid is needed. Careful thought has to be given to whether or not these costs should be included in the cost of power.
Should R&D, tax, and environmental impact studies be included? Should the costs of impacts on public health and environmental damage be included? Should the costs of government subsidies be included in the calculated LEC?
Discount rate
Another key issue is the decision about the value of the discount rate r. The value that is chosen for r can often 'weigh' the decision towards one option or another, so the basis for choosing the discount must clearly be carefully evaluated. See Internal rate of return. The discount rate depends on the cost of capital, including the balance between debt-financing and equity-financing, and an assessment of the financial risk.
US Department of Energy estimates
The tables below list the estimated cost of electricity by source for plants entering service in 2016. The tables are from a December 16, 2010 report of the Energy Information Administration (EIA) of the U.S. Department of Energy (DOE) called "Levelized Cost of New Generation Resources in the Annual Energy Outlook 2011".[12]
- Total System Levelized Cost (the rightmost column) gives the dollar cost per megawatt-hour that must be charged over time in order to pay for the total cost. Divide by 1000 to get the cost per kilowatt-hour (move the decimal point 3 places to the left).
These calculations reflect an adjustment to account for the high level of carbon dioxide produced by coal plants. From the EIA report:
- "a 3-percentage point increase in the cost of capital is added when evaluating investments in greenhouse gas (GHG) intensive technologies like coal-fired power and coal-to-liquids (CTL) plants without carbon control and sequestration (CCS). While the 3-percentage point adjustment is somewhat arbitrary, in levelized cost terms its impact is similar to that of a $15 per metric ton of carbon dioxide (CO2) emissions fee. ... As a result, the levelized capital costs of coal-fired plants without CCS are higher than would otherwise be expected."[12]
No tax credits or incentives are incorporated in the tables. From the EIA report (emphasis added):
- "Levelized cost represents the present value of the total cost of building and operating a generating plant over an assumed financial life and duty cycle, converted to equal annual payments and expressed in terms of real dollars to remove the impact of inflation. Levelized cost reflects overnight capital cost, fuel cost, fixed and variable O&M cost, financing costs, and an assumed utilization rate for each plant type. The availability of various incentives including state or federal tax credits can also impact the calculation of levelized cost. The values shown in the tables below do not incorporate any such incentives."[12]
Incentives, tax credits, production mandates, etc. are discussed in the overall comprehensive EIA report: "Annual Energy Outlook 2011".[13][14][15]
- O&M = operation and maintenance.
- CC = combined cycle.
- CCS = carbon capture and sequestration.
- PV = photovoltaics.
- GHG = greenhouse gas.
UK 2010 estimates
In March 2010, a new report on UK levelised generation costs was published by Parsons Brinckerhoff.[16] It puts a range on each cost due to various uncertainties. Combined cycle gas turbines without CO2 capture are not directly comparable to the other low carbon emission generation technologies in the PB study. The assumptions used in this study are given in the report, the report did not cover Solar power or include the New Nuclear's " hidden " government subsidies of 18 £/MWh to 67 £/MWh[citation needed] above the stated figures.
UK energy costs for different generation technologies in pounds per megawatt hour (2010) Technology Cost range (£/MWh) New nuclear 80–105 Onshore wind 80–110 Biomass 60–120 Natural gas turbines with CO2 capture 60–130 Coal with CO2 capture 100–155 Solar farms 125–180 Offshore wind 150–210 Natural gas turbine, no CO2 capture 55–110 Tidal power 155–390 Divide the above figures by 10 to obtain the price in pence per kilowatt-hour "unit".
A further UK 2010 estimate is the Mott MacDonald study released by DECC in June 2010 : [17]
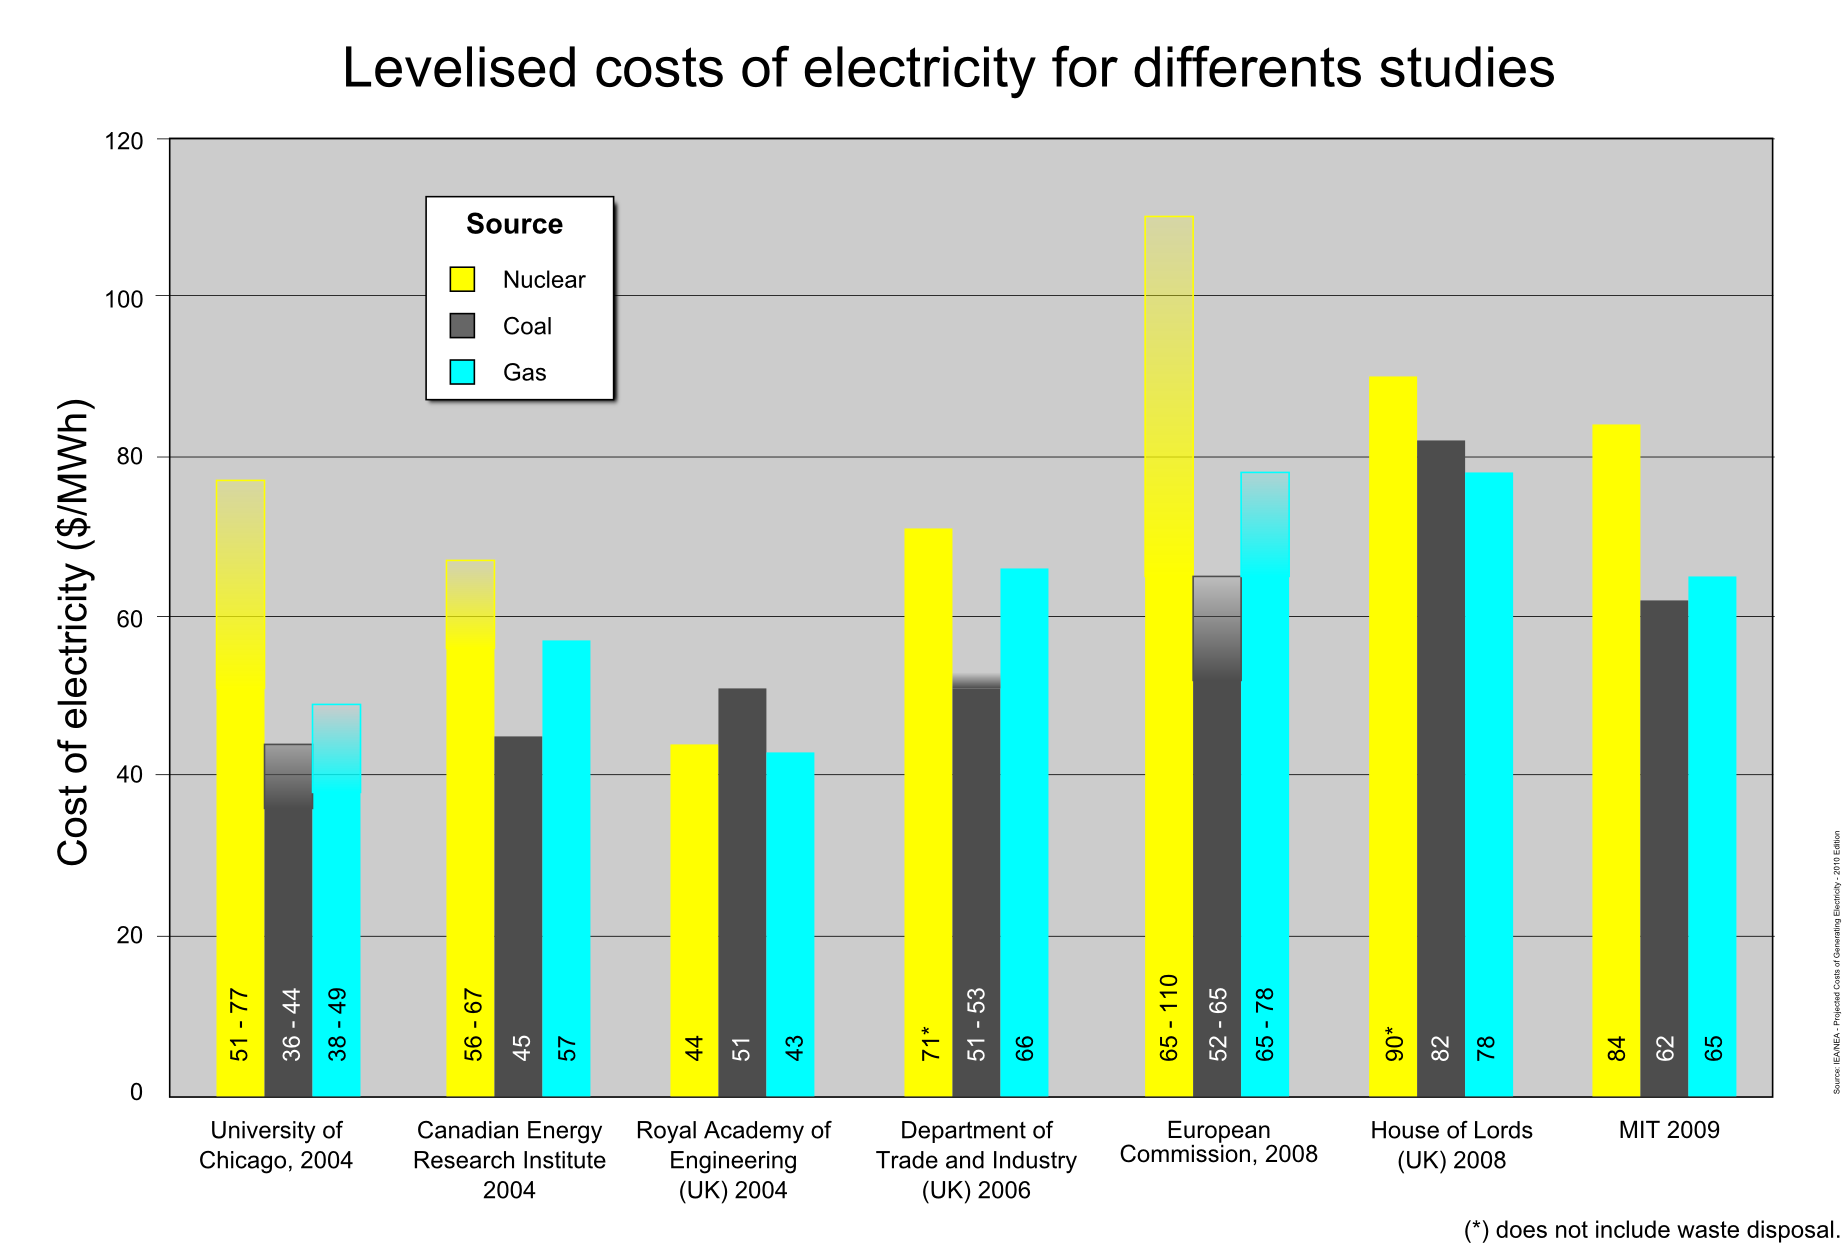
Analysis from different sources

█ Conventional oil █ Unconventional oil █ Biofuels █ Coal █ Nuclear █ Wind Colored vertical lines indicate various historical oil prices. From left to right: — 1990s average — January 2009 — 1979 peak — 2008 peak Price of oil per barrel (bbl) at which energy sources are competitive.
- Right end of bar is viability without subsidy.
- Left end of bar requires regulation or government subsidies.
- Wider bars indicate uncertainty.
A draft report of LECs used by the California Energy Commission is available.[18] From this report, the price per MWh for a municipal energy source is shown here:
California levelized energy costs for different generation technologies in US dollars per megawatt hour (2007) Technology Cost (USD/MWh) Advanced Nuclear 67 Coal 74–88 Gas 87–346 Geothermal 67 Hydro power 48–86 Wind power 60 Solar 116–312 Biomass 47–117 Fuel Cell 86–111 Wave Power 611 Note that the above figures incorporate tax breaks for the various forms of power plants. Subsidies range from 0% (for Coal) to 14% (for nuclear) to over 100% (for solar).
Other sources are given here,[4][5]
The following table gives a selection of LECs from two major government reports from Australia.[19][20] Note that these LECs do not include any cost for the greenhouse gas emissions (such as under carbon tax or emissions trading scenarios) associated with the different technologies.
Levelised energy costs for different generation technologies in Australian dollars per megawatt hour (2006) Technology Cost (AUD/MWh) Nuclear (to COTS plan)[20] 40–70 Nuclear (to suit site; typical)[20] 75–105 Coal 28–38 Coal: IGCC + CCS 53–98 Coal: supercritical pulverized + CCS 64–106 Open-cycle Gas Turbine 101 Hot fractured rocks 89 Gas: combined cycle 37–54 Gas: combined cycle + CCS 53–93 Small Hydro power 55 Wind power: high capacity factor 63 Solar thermal 85 Biomass 88 Photovoltaics 120 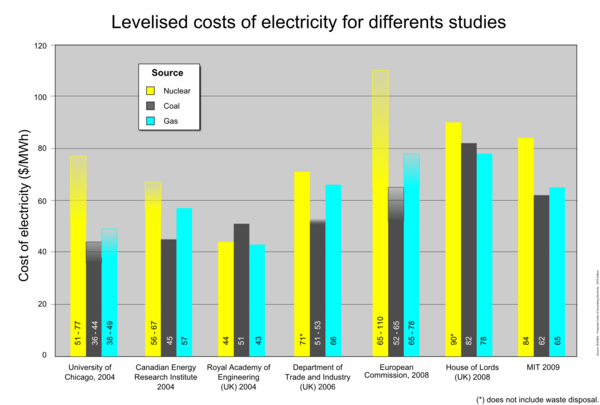

In 1997 the Trade Association for Wind Turbines (Wirtschaftsverband Windkraftwerke e.V. –WVW) ordered a study into the costs of electricity production in newly constructed conventional power plants from the Rheinisch-Westfälischen Institute for Economic Research –RWI). The RWI predicted costs of electricity production per kWh for the basic load for the year 2010 as follows:[citation needed]
Fuel Cost per kilowatt hour in euro cents. Nuclear Power 10.7 €ct – 12.4 €ct Brown Coal (Lignite) 8.8 €ct – 9.7 €ct Black Coal (Bituminous) 10.4 €ct – 10.7 €ct Natural gas 11.8 €ct – 10.6 €ct. The part of a base load represents approx. 64% of the electricity production in total. The costs of electricity production for the mid-load and peak load are considerably higher. There is a mean value for the costs of electricity production for all kinds of conventional electricity production and load profiles in 2010 which is 10.9 €ct to 11.4 €ct per kWh. The RWI calculated this on the assumption that the costs of energy production would depend on the price development of crude oil and that the price of crude oil would be approx. 23 US$ per barrel in 2010. In fact the crude oil price is about 80 US$ in the beginning of 2010. This means that the effective costs of conventional electricity production still need to be higher than estimated by the RWI in the past.
The WVW takes the legislative feed-in-tariff as basis for the costs of electricity production out of renewable energies because renewable power plants are economically feasible under the German law (German Renewable Energy Sources Act-EEG).
The following figures arise for the costs of electricity production in newly constructed power plants in 2010:[citation needed]
Energy source Costs of electricity production in euros per megawatt hour Nuclear Energy 107.0 – 124.0 Brown Coal 88.0 – 97.0 Black Coal 104.0 – 107.0 Domestic Gas 106.0 – 118.0 Wind Energy Onshore 49.7 – 96.1 Wind Energy Offshore 35.0 – 150.0 Hydropower 34.7 – 126.7 Biomass 77.1 – 115.5 Solar Electricity 284.3 – 391.4 Other estimates
A 2010 study by the Japanese government, called the Energy White Paper, concluded the cost for kilowatt hour was ¥49 for solar, ¥10 to ¥14 for wind, and ¥5 or ¥6 for nuclear power. Masayoshi Son, an advocate for renewable energy, however, has pointed out that the government estimates for nuclear power did not include the costs for reprocessing the fuel or disaster insurance liability. Son estimated that if these costs were included, the cost of nuclear power was about the same as wind power.[21][22][23]
Beyond the power station terminals, or system costs
The raw costs developed from the above analysis are only part of the picture in planning and costing a large modern power grid. Other considerations are the temporal load profile, i.e. how load varies second to second, minute to minute, hour to hour, month to month. To meet the varying load, generally a mix of plant options is needed, and the overall cost of providing this load is then important. Wind power has poor capacity contribution, so during windless periods, some form of back up must be provided. All other forms of power generation also require back up, though to a lesser extent. To meet peak demand on a system, which only persist for a few hours per year, it is often worth using very cheap to build, but very expensive to operate plant - for example some large grids also use load shedding coupled with diesel generators [24] at peak or extreme conditions - the very high kWh production cost being justified by not having to build other more expensive capacity and a reduction in the otherwise continuous and inefficient use of spinning reserve.
In the case of wind energy, the additional costs in terms of increased back up and grid interconnection to allow for diversity of weather and load may be substantial. This is because wind stops blowing frequently even in large areas at once and for prolonged periods of time. Some wind advocates have argue that in the pan-European case back up costs are quite low, resulting in overall wind energy costs about the same as present day power.[25] However, such claim are generally considered too optimistic, except possibly for some marginal increases that, in particular circumstances, may take advantage of the existing infrastructure.
The cost in the UK of connecting new offshore wind in transmission terms, has been consistently put by Grid/DECC/Ofgem at £15billion by 2020. This £15b cost does not include the cost of any new connections to Europe - interconnectors, or a supergrid, as advocated by some. The £15b cost is the cost of connecting offshore wind farms by cables typically less than 12 km in length, to the UK's nearest suitable onshore connection point. There are total forecast onshore transmission costs of connecting various new UK generators by 2020, as incurred from 2010, of £4.7 billion, by comparison.
When a new plant is being added to a power system or grid, the effects are quite complex - for example, when wind energy is added to a grid, it has a marginal cost associated with production of about £20/MWh (most incurred as lumpy but running-related maintenance - gearbox and bearing failures, for instance, and the cost of associated downtime), and therefore will always offer cheaper power than fossil plant - this will tend to force the marginally most expensive plant off the system. A mid range fossil plant, if added, will only force off those plants that are marginally more expensive. Hence very complex modelling of whose systems is required to determine the likely costs in practice of a range of power generating plant options, or the effect of adding a given plant.
With the development of markets, it is extremely difficult for would-be investors to estimate the likely impacts and cost benefit of an investment in a new plant, hence in free market electricity systems, there tends to be an incipient shortage of capacity, due to the difficulties of investors accurately estimating returns, and the need to second guess what competitors might do.[citation needed]
Additional nuclear power costs
Main article: Economics of new nuclear power plantsNuclear power plants built recently, or in the process of being built, have incurred many cost overruns. Those being built now are expected to incur further cost overruns due to design changes after the Fukushima Daiichi nuclear disaster.[26]
Nuclear power has in the past been granted indemnity from the burden of carrying full third party insurance liabilities in accordance with the Paris convention on nuclear third-party liability, the Brussels supplementary convention, and the Vienna convention on civil liability for nuclear damage.[27]
The limited insurance that is required does not cover the full cost of a major nuclear accident of the kind that occurred at Chernobyl or Fukushima. An April 2011 report by Versicherungsforen Leipzig, a Leipzig company that specializes in actuarial calculations shows that full insurance against nuclear disasters would increase the price of nuclear electricity by €0.14/kWh ($0.20/kWh) to €2.36/kWh ($3.40/kWh).[28][29][30][31][32][33]
See also
- Comparisons of life-cycle greenhouse gas emissions
- Distributed generation
- Economics of new nuclear power plants
- Demand response
- Intermittent energy source
- National Grid Reserve Service
- Calculating the cost of the UK Transmission network: cost per kWh of transmission
- List of countries by electricity production from renewable sources
- List of U.S. states by electricity production from renewable sources
- Environmental concerns with electricity generation
- Grid parity
References
- ^ http://www.ukerc.ac.uk/Downloads/PDF/07/0706_TPA_A_Review_of_Electricity.pdf A REVIEW OF ELECTRICITY UNIT COST ESTIMATES Working Paper, December 2006 - Updated May 2007
- ^ http://www.claverton-energy.com/killer-wind-graphs.html
- ^ http://www.claverton-energy.com/energy-experts-library/downloads/windenergy David Millborrows paper on wind costs
- ^ a b http://www.claverton-energy.com/?dl_id=384
- ^ a b http://www.claverton-energy.com/?dl_id=385
- ^ http://www.claverton-energy.com/killer-wind-graphs.html Relative / comparative costs of wind energy, nuclear energy, hydro power, coal power, natural gas, geothermal energy, and biomass
- ^ "NUREG-1350 Vol. 18: NRC Information Digest 2006-2007" (PDF). Nuclear Regulatory Commission. 2006. http://www.nrc.gov/reading-rm/doc-collections/nuregs/staff/sr1350/. Retrieved 2007-01-22.
- ^ The Path to Grid Parity (Graphic)
- ^ BBC News - Paying for wind we don't use: How effective is wind?
- ^ Review of Solar Levelized Cost
- ^ Nuclear Energy Agency/International Energy Agency/Organization for Economic Cooperation and Development Projected Costs of Generating Electricity (2005 Update)
- ^ a b c Levelized Cost of New Generation Resources in the Annual Energy Outlook 2011. Released December 16, 2010. Report of the US Energy Information Administration (EIA) of the U.S. Department of Energy (DOE).
- ^ Annual Energy Outlook 2011. U.S. Energy Information Administration (EIA) of the U.S. Department of Energy (DOE)].
- ^ Assumptions to the Annual Energy Outlook 2011. U.S. Energy Information Administration of the U.S. Department of Energy.
- ^ Appendix A: Handling of Federal and Selected State Legislation and Regulation in the Annual Energy Outlook. US Energy Information Administration of the U.S. Department of Energy.
- ^ Powering the Nation Update 2010 retrieved 2010 Nov 9
- ^ Mott MacDonald study released by DECC in June 2010
- ^ http://www.energy.ca.gov/2007publications/CEC-200-2007-011/CEC-200-2007-011-SD.PDF
- ^ Graham, P. The heat is on: the future of energy in Australia CSIRO, 2006
- ^ a b c Switkowski, Z. Uranium Mining, Processing and Nuclear Energy Review UMPNER taskforce, Australian Government, 2006
- ^ Johnston, Eric, "Son's quest for sun, wind has nuclear interests wary", Japan Times, 12 July 2011, p. 3.
- ^ Bird, Winifred, "Powering Japan's future", Japan Times, 24 July 2011, p. 7.
- ^ Johnston, Eric, "Current nuclear debate to set nation's course for decades", Japan Times, 23 September 2011, p. 1.
- ^ http://www.claverton-energy.com/?dl_id=131
- ^ http://www.claverton-energy.com/talk-by-dr-gregor-czisch-at-the-5th-claverton-energy-conference-house-of-commons-june-19th-2009.html Claverton Energy Group conference, House of Commons, 19 June 2009
- ^ Nuclear power's real chain reaction: spiraling costs. By Damian Carrington. 22 July 2011. The Guardian.
- ^ Publications: Vienna Convention on Civil Liability for Nuclear Damage. International Atomic Energy Agency.
- ^ Nuclear Power Expensive, Uninsurable. 3 June 2011. By Paul Gipe. Solar Today magazine.
- ^ Versicherungswissenschaft belegt: AKW sind nicht versicherbar – adäquate Haftpflichtprämien würden Atomstrom unwirtschaftlich machen | BEE – Bundesverband Erneuerbare Energie e.V.. English translation of report summary here.
- ^ Berechnung einer risikoadäquaten Versicherungsprämie zur Deckung der Haftp ichtrisiken, die aus dem Betrieb von Kernkraftwerken resultieren (10 MB). 1 April 2011. Versicherungsforen Leipzig.
- ^ Reports and articles - Energy Fair. Section starting with "Researchers calculate horrendous liability costs for nuclear power (Der Spiegel, 2011-05-11)."
- ^ Why the UK must choose renewables over nuclear: an answer to Monbiot. By Jonathon Porritt. 26 July 2011. The Guardian.
- ^ Monbiot is "Part of the Problem": Jonathan Porritt on the Folly of Nuclear Power. By Sami Grover. 27 July 2011. TreeHugger.
Further reading
- Nuclear Power: Still Not Viable without Subsidies. February 2011. By Doug Koplow. Union of Concerned Scientists.
- How to Calculate the Levelized Cost of Energy – a simplified approach | Energy Technology Expert. Engineer Marcial T. Ocampo.
- Levelized Cost of New Electricity Generating Technologies. Institute for Energy Research.
- Review of Solar Levelized Cost
Human impact on the environment Causes AgricultureFishing · Irrigation · Meat production · Palm oilBiodiesel · Coal mining and burning · Electricity generation · Nuclear power · Oil shale industry · Petroleum · Reservoirs · Wind powerManufactured productsCleaning agents · Nanotechnology · Paint · Paper · Pesticides · Pharmaceuticals and personal care productsTransportOtherMining · WarEffects Coral reefs · Nitrogen cycleCategories:- Energy costs
- Electricity economics
- Economics comparisons
Wikimedia Foundation. 2010.