- Demographics of Namibia
-
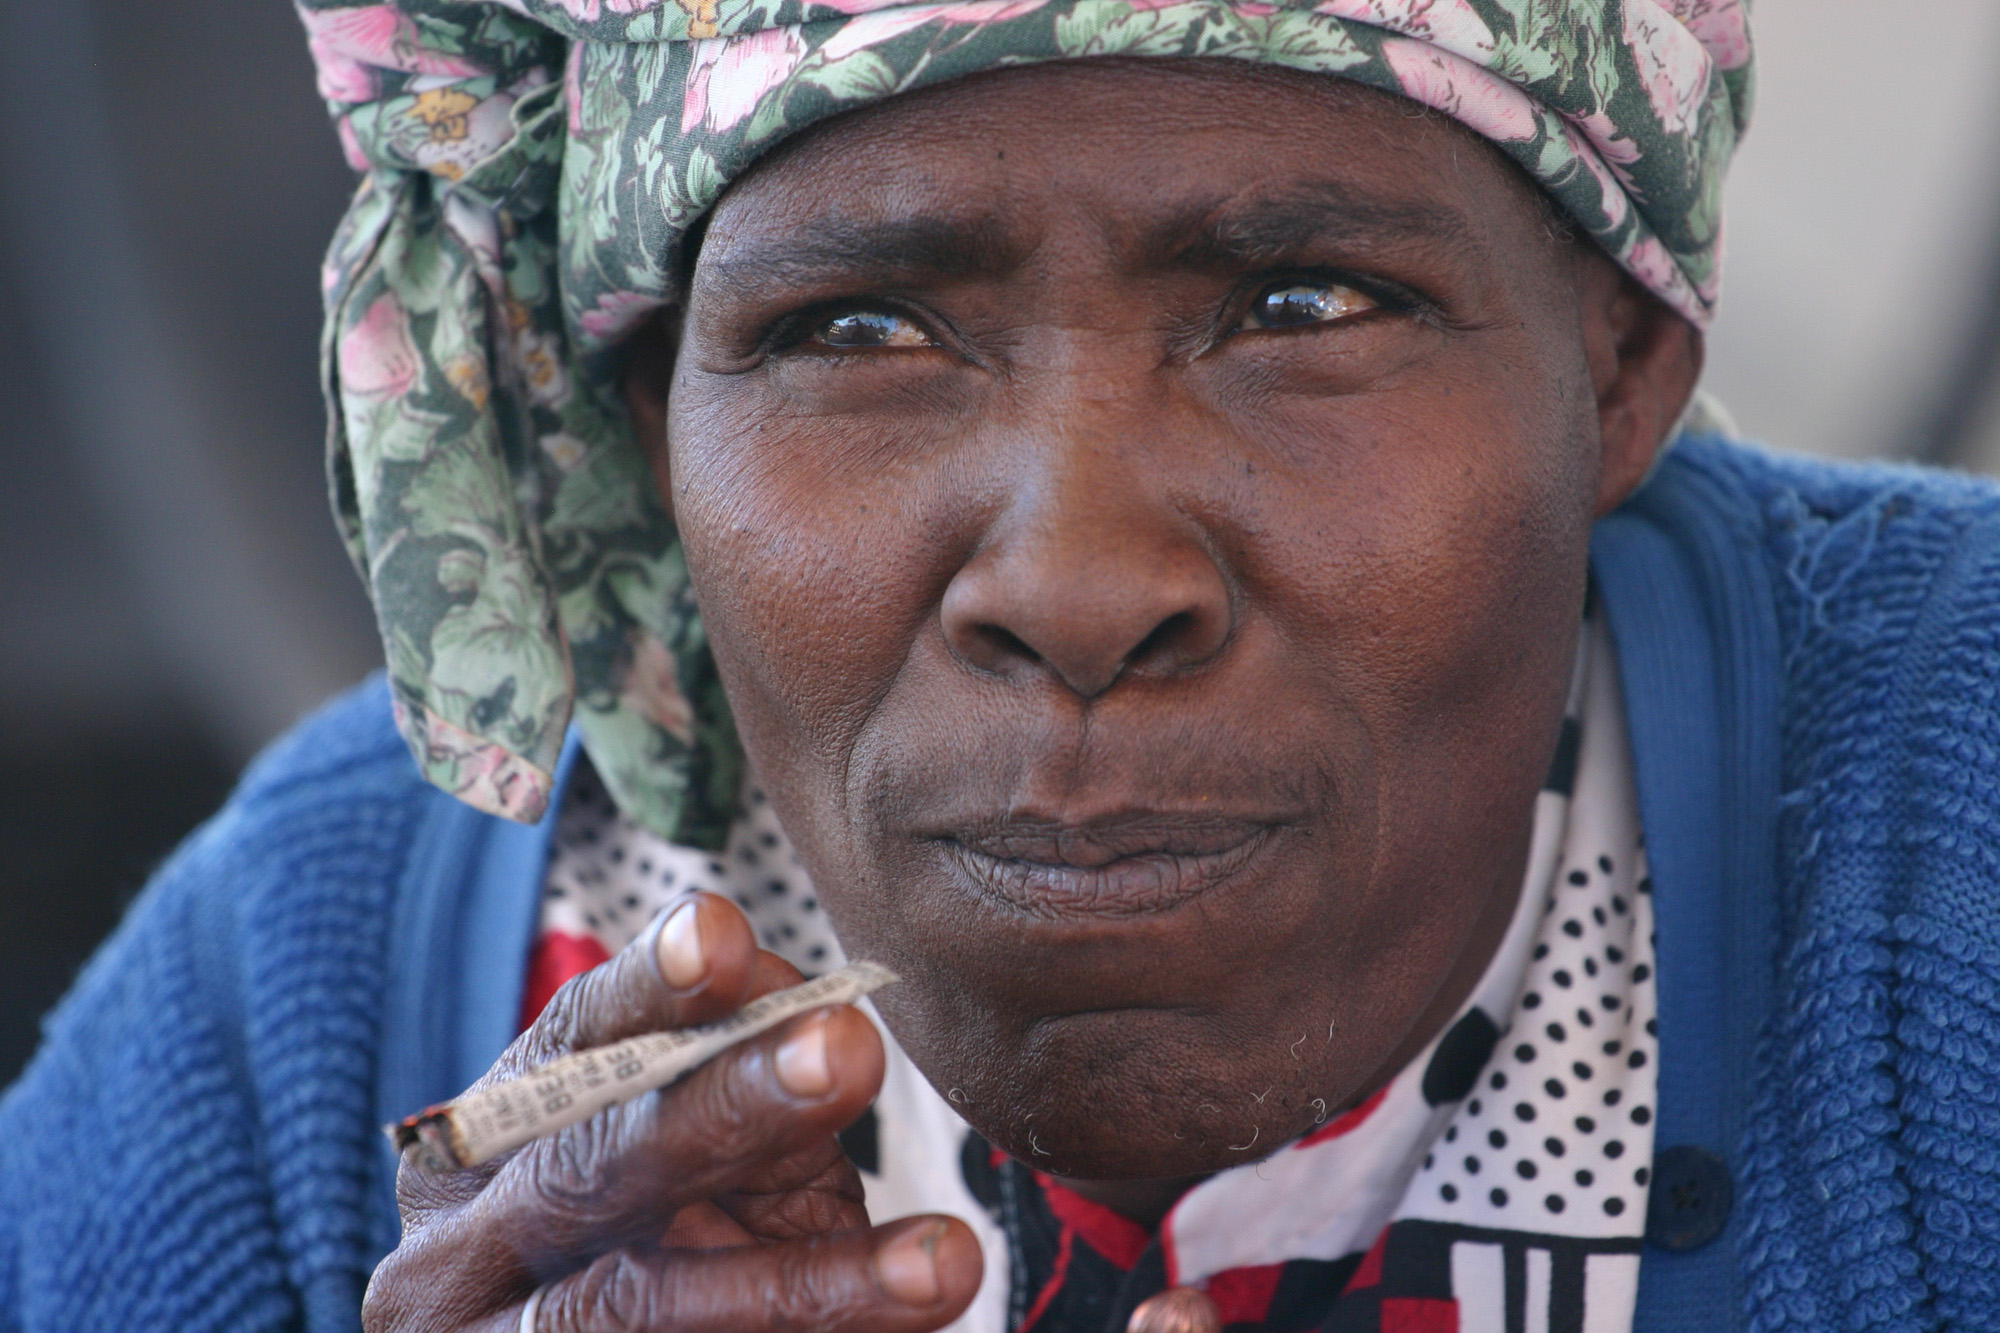
 A smoking Nama woman
This article is about the demographic features of the population of Namibia, including population density, ethnicity, education level, health of the populace, economic status, religious affiliations and other aspects of the population.
Namibians are of diverse ethnic origins. The principal groups are the Ovambo, Kavango, Herero/Himba, Damara, mixed race (Coloured and Rehoboth Baster), White Namibians (Afrikaner, German, and Portuguese), Nama, Caprivian (Lozi), Bushmen (San), and Tswana. The Coloureds and Basters share similar genealogical origins and cultural attributes (such as home language) but nonetheless maintain distinctly separate communal identities, as do most white Namibians and black Namibians, respectively.
The Ovambo make up about half of Namibia's people. The Ovambo, Kavango, and East Caprivian peoples, who occupy the relatively well-watered and wooded northern part of the country, are settled farmers and herders. Historically, they have shown little interest in the central and southern parts of Namibia, where conditions do not suit their traditional way of life.
Until the early 20th century, these tribes had little contact with the Nama, Damara, and Herero, who roamed the central part of the country vying for control of sparse pastureland. German colonial rule destroyed the warmaking ability of the tribes but did not erase their identities or traditional organization. People from the more populous north have settled throughout the country in recent decades as a result of urbanization, industrialization, and the demand for labor.
The modern mining, farming, and industrial sectors of the economy, controlled by the white minority, have affected traditional African society without transforming it. Urban and migratory workers have adopted Western ways, but in rural areas, traditional society remains intact.
Missionary work during the 19th century drew many Namibians to Christianity, especially Lutheranism. While most Namibian Christians are Lutheran, there also are Roman Catholic, Methodist, Anglican, African Methodist Episcopal, and Dutch Reformed Christians represented.
Modern education and medical care have been extended in varying degrees to most rural areas in recent years. The literacy rate of Africans is generally low except in sections where missionary and government education efforts have been concentrated, such as Ovamboland. The Africans speak various indigenous languages.
The minority white population is primarily of South African, British, and German descent, with a few Portuguese. About 60% of the whites speak Afrikaans (a language derived from the 17th century Dutch), 32% speak German, and 7% speak English.
CIA World Factbook demographic statistics
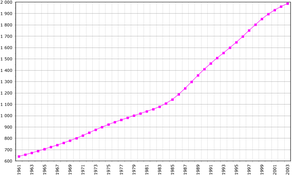 Demographics of Namibia, Data of FAO, year 2005 ; Number of inhabitants in thousands.
The following demographic statistics are from the CIA World Factbook,[1] unless otherwise indicated.
Population
- 2,147,585 (July 2011 est.)
- 2,088,669 (July 2008 est.)
- 1,927,447 (July, 2003 est.)
- 1,771,327 (July 2002 est.)
note: estimates for this country explicitly take into account the effects of excess mortality due to AIDS; this can result in lower life expectancy, higher infant mortality and death rates, lower population and growth rates, and changes in the distribution of population by age and sex than would otherwise be expected
Age structure
0–14 years: 42.5% (male 414,559; female 404,346) (2003 est.), 43% (male 384,900; female 375,282) (2000 est.)
15–64 years: 54% (male 517,469; female 522,549) (2003 est.), 53% (male 468,942; female 475,504) (2000 est.)
65 years and over: 3.5% (male 30,038; female 38,486) (2003 est.), 4% (male 28,905; female 37,794) (2000 est.)Population growth rate
- 0.95% (2009 est.)
- 0.94% (2008 est.)
- 1.49% (2003 est.)
- 1.57% (2000 est.)
Birth rate
21.48 births/1,000 population (2011 est.)
Death rate
12.95 deaths/1,000 population (2011 est.)
Net migration rate
0.2 migrant(s)/1,000 population (2011 est.)
Sex ratio
at birth: 1.03 male(s)/female (2003, 2000 est.)
under 15 years: 1.03 male(s)/female (2003, 2000 est.)
15–64 years: 0.99 male(s)/female (2003, 2000 est.)
65 years and over: 0.78 male(s)/female (2003 est.), 0.76 male(s)/female (2000 est.)
total population: 1 male(s)/female (2003 est.), 0.99 male(s)/female (2000 est.)Infant mortality rate
total: 45.59 deaths/1,000 live births (2011 est.), 68.44 deaths/1,000 live births (2003 est.)
female: 42.21 deaths/1,000 live births (2011 est.)
male: 48.86 deaths/1,000 live births (2011 est.)Life expectancy at birth
- total population: 52.19 years
- male: 52.48 years
- female: 51.89 years (2011 est.)
Total fertility rate
2.49 children born/woman (2011 est.)
2.81 children born/woman (2008 est.)
4.71 children born/woman (2003 est.)HIV/AIDS - adult prevalence rate
13.1% (2009 est.)
HIV/AIDS - people living with HIV/AIDS
180,000 (2009 est.)
HIV/AIDS - deaths
6,700 (2009 est.)
Nationality
noun: Namibian(s)
adjective: NamibianEthnic groups
The ethnic composition of the population of Namibia has last been measured in 1989,[2] prior to Namibian independence, when the population total stood at 1.4 million. At that time the relative sizes of the ethnic groups were:[2]
Ethnic group Percentage Ovambo 49.8 Kavango 9.3 Damara 7.5 Herero 7.5 Whites 6.4 Nama 4.8 Coloureds 4.1 Caprivian 3.7 San 2.9 Rehoboth Basters 2.5 Tswana 0.6 Other 0.9 Total 100 Since then, a large number of Chinese is estimated to have taken up residence, estimated to have been 40,000 in 2006.[3] This would correspond to 2% of the 2 million people at that time.
Religions
Christian 80% to 90% (Lutheran 50% at least), indigenous beliefs 10% to 20% (see Religion in Namibia)
Languages
Oshiwambo languages are spoken by 48% of the population, the Khoekhoe language by 11%, Afrikaans by 11%, Kavango languages by 10% and Herero by 10%. English, the official language, is spoken by less than 1% of people as their native language. Among whites, 60% speak Afrikaans, 32% German, 7% English, and 1% Portuguese.
-

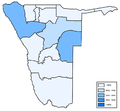
Distribution of Oshiwambo
-

Distribution of Khoekhoe (also known as Nama or Damara)
-

Distribution of Afrikaans
-
Distribution of Otjiherero
-

Distribution of Kavango languages
-

Distribution of Caprivi languages
Literacy
definition: age 15 and over can read and write
total population: 84% (2003 est.) 38% (1960 est.)
male: 84.4% (2003 est.), 45% (1960 est.)
female: 83.7% (2003 est.) 31% (1960 est.)References
- ^ Central Intelligence Agency (2009). "Namibia". The World Factbook. https://www.cia.gov/library/publications/the-world-factbook/geos/wa.html. Retrieved January 23, 2010.
- ^ a b Malan, Johan S. (1998). Die Völker Namibias [The Peoples of Namibia] (1 ed.). Windhoek, Göttingen: Klaus Hess. pp. 8–10. ISBN 3-933117-10-0.
- ^ "40,000 Chinese in Namibia". The Namibian (as quoted in the Southern African Migration Project (SAMP)). 21 November 2006. http://www.queensu.ca/samp/migrationnews/article.php?Mig_News_ID=4107&Mig_News_Issue=23&Mig_News_Cat=7. Retrieved 21 March 2011.
Demographics of Africa Sovereign
states- Algeria
- Angola
- Benin
- Botswana
- Burkina Faso
- Burundi
- Cameroon
- Cape Verde
- Central African Republic
- Chad
- Comoros
- Democratic Republic of the Congo
- Republic of the Congo
- Côte d'Ivoire (Ivory Coast)
- Djibouti
- Egypt
- Equatorial Guinea
- Eritrea
- Ethiopia
- Gabon
- The Gambia
- Ghana
- Guinea
- Guinea-Bissau
- Kenya
- Lesotho
- Liberia
- Libya
- Madagascar
- Malawi
- Mali
- Mauritania
- Mauritius
- Morocco
- Mozambique
- Namibia
- Niger
- Nigeria
- Rwanda
- São Tomé and Príncipe
- Senegal
- Seychelles
- Sierra Leone
- Somalia
- South Africa
- South Sudan
- Sudan
- Swaziland
- Tanzania
- Togo
- Tunisia
- Uganda
- Zambia
- Zimbabwe
States with limited
recognition- Sahrawi Arab Democratic Republic
- Somaliland
Dependencies and
other territories- Canary Islands / Ceuta / Melilla / Plazas de soberanía (Spain)
- Madeira (Portugal)
- Mayotte / Réunion (France)
- Saint Helena / Ascension Island / Tristan da Cunha (United Kingdom)
- Western Sahara
Categories:


Wikimedia Foundation. 2010.