- Table of United States Metropolitan Statistical Areas
-
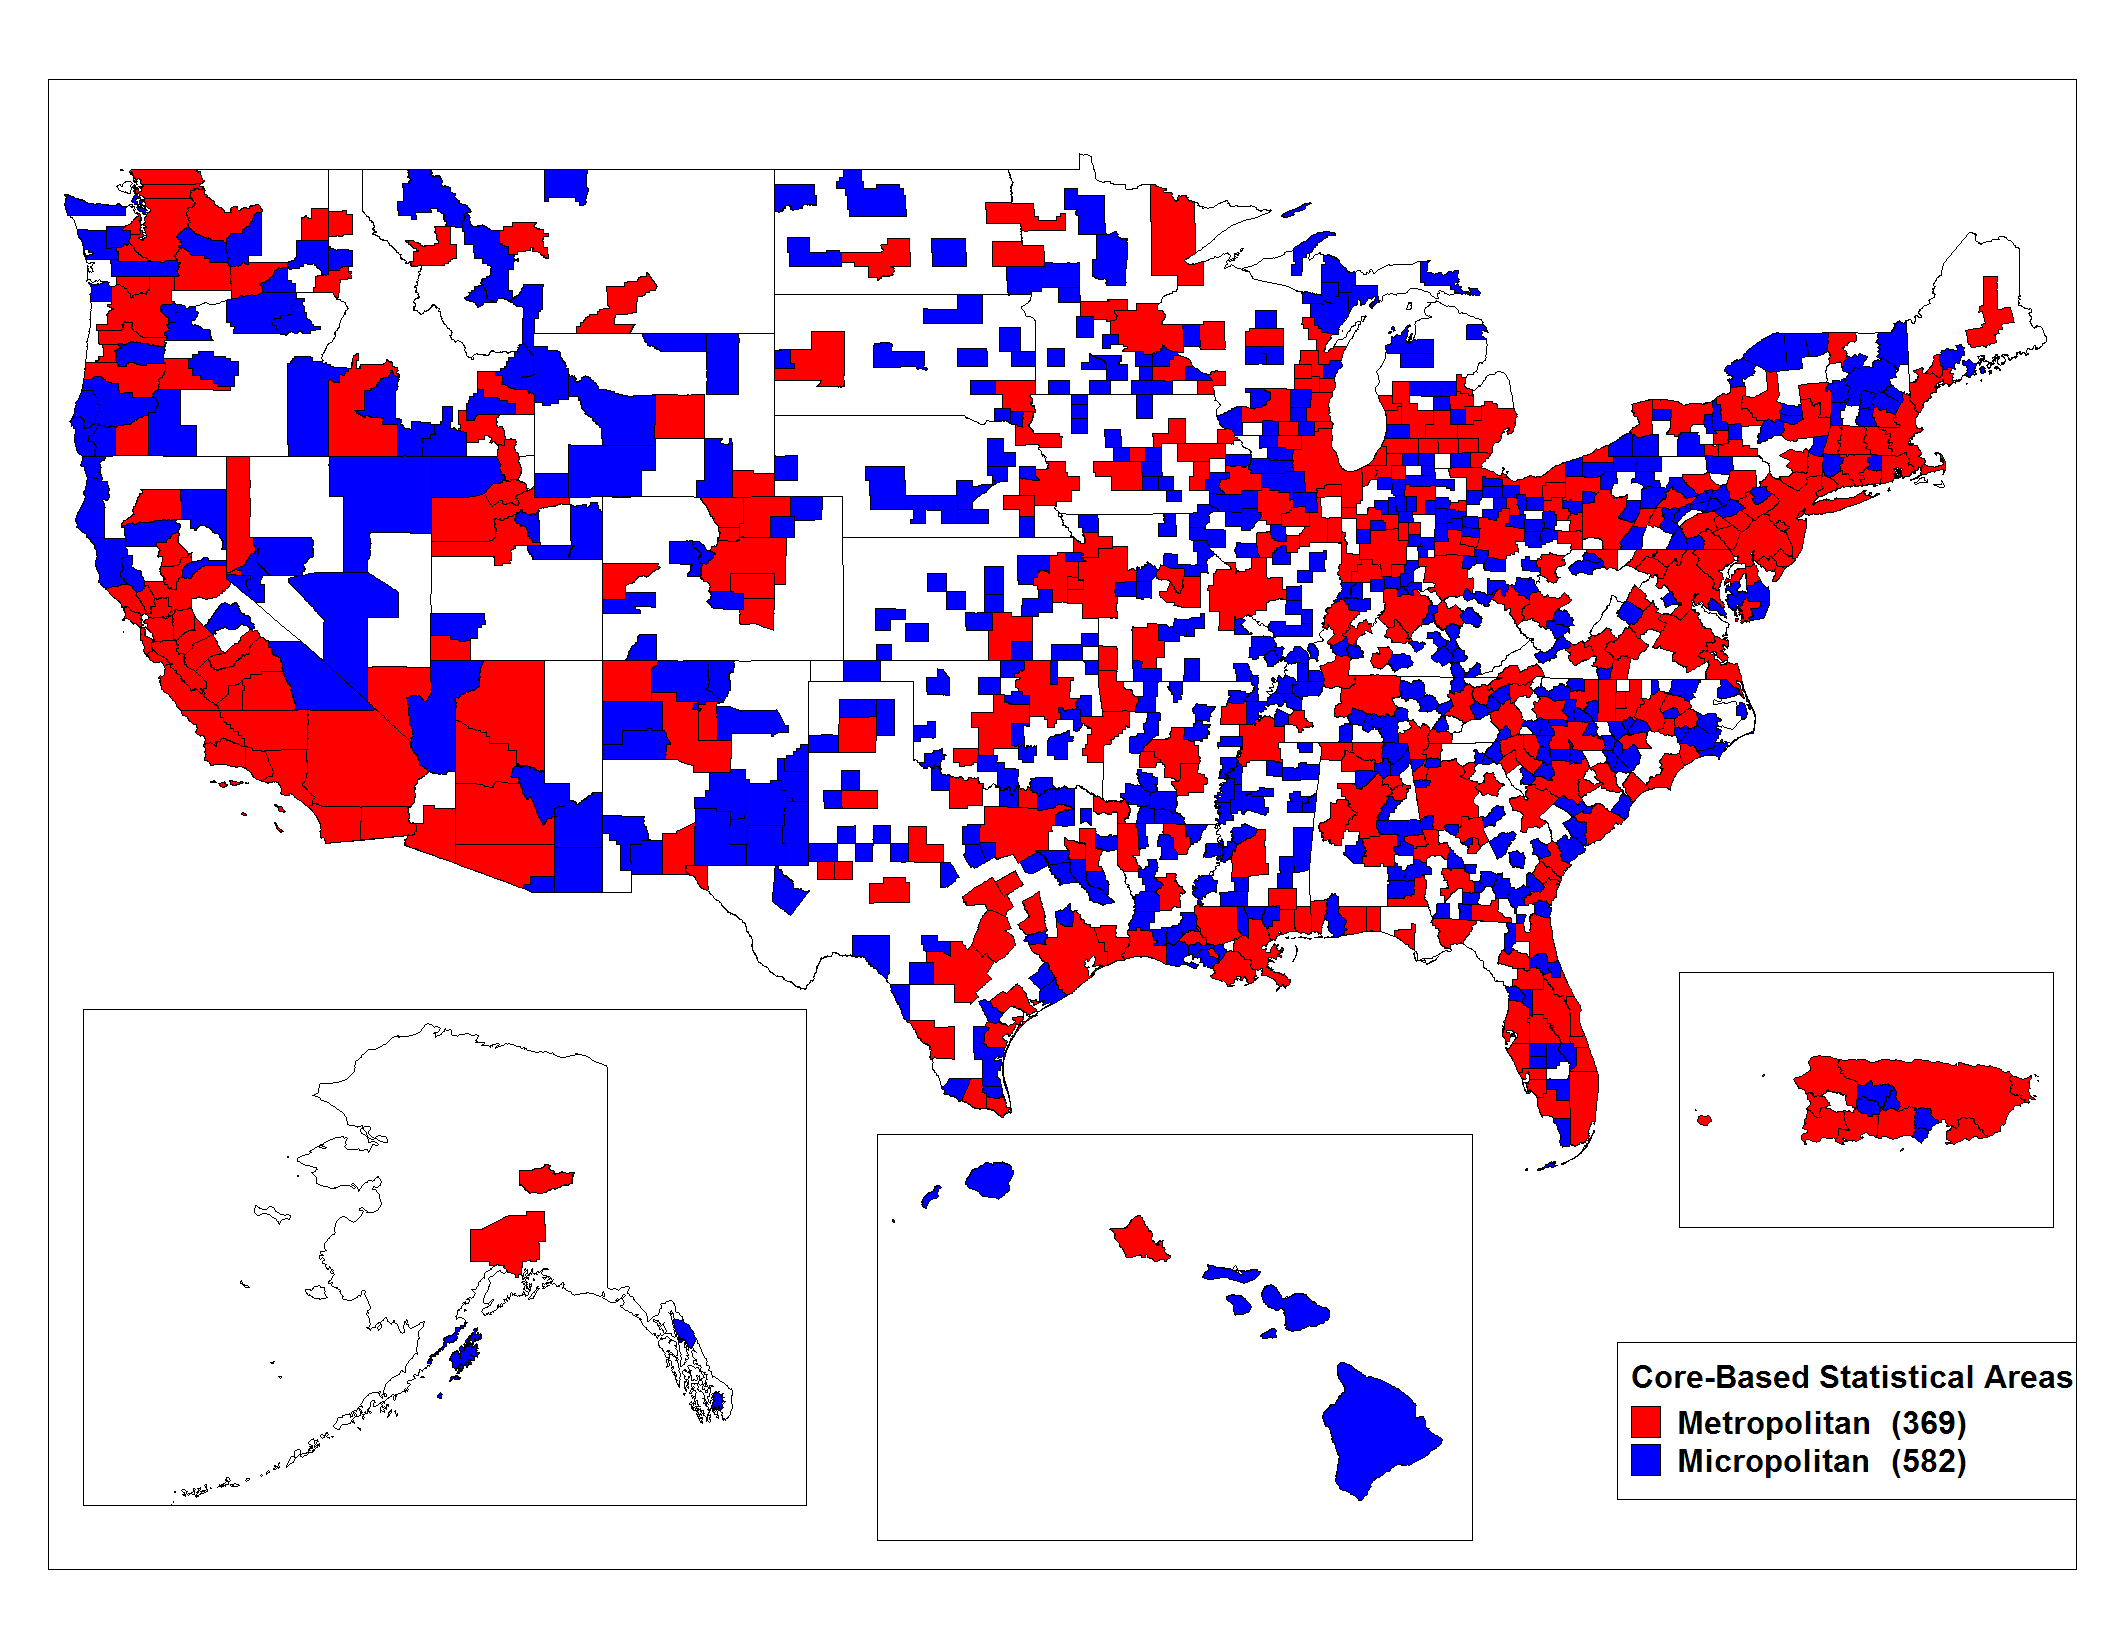
 An enlargeable map of the 942 Core Based Statistical Areas (CBSAs) of the United States. The 367 Metropolitan Statistical Areas (MSAs) are shown in red.
 Main articles: Metropolitan Statistical Area and Core Based Statistical Area
The United States Office of Management and Budget (OMB) has defined 367 Metropolitan Statistical Areas (MSAs)[1] for the United States. The OMB defines a Metropolitan Statistical Area as one or more adjacent counties or county equivalents that have at least one urban core area of at least 50,000 population, plus adjacent territory that has a high degree of social and economic integration with the core as measured by commuting ties.[2]
Contents
Table
The following sortable table lists the 367 Metropolitan Statistical Areas (MSAs) of the United States with the following information:
- The MSA rank by population as of April 1, 2010, as counted by the United States Census 2010[3]
- The MSA name as defined by the United States Office of Management and Budget[2]
- The MSA population as of April 1, 2010, as counted by the United States Census 2010[3]
- The MSA population as of April 1, 2000, as counted by the United States Census 2000[3]
- The percent MSA population change from April 1, 2000, to April 1, 2010, as counted by the United States Census Bureau[3]
- The Combined Statistical Area (CSA)[4] if the MSA is a component[2]
Metropolitan Statistical Areas of the United States of America Rank Metropolitan Statistical Area 2010 Pop 2000 Pop Change Combined Statistical Area 1 New York-Northern New Jersey-Long Island, NY-NJ-PA MSA 18,897,109 18,323,002 +3.13% New York-Newark-Bridgeport, NY-NJ-CT-PA CSA 2 Los Angeles-Long Beach-Santa Ana, CA MSA 12,828,837 12,365,627 +3.75% Los Angeles-Long Beach-Riverside, CA CSA 3 Chicago-Joliet-Naperville, IL-IN-WI MSA 9,461,105 9,098,316 +3.99% Chicago-Naperville-Michigan City, IL-IN-WI CSA 4 Dallas-Fort Worth-Arlington, TX MSA 6,371,773 5,161,544 +23.45% Dallas-Fort Worth, TX CSA 5 Philadelphia-Camden-Wilmington, PA-NJ-DE-MD MSA 5,965,343 5,687,147 +4.89% Philadelphia-Camden-Vineland, PA-NJ-DE-MD CSA 6 Houston-Sugar Land-Baytown, TX MSA 5,946,800 4,715,407 +26.11% Houston-Baytown-Huntsville, TX CSA 7 Washington-Arlington-Alexandria, DC-VA-MD-WV MSA 5,582,170 4,796,183 +16.39% Washington-Baltimore-Northern Virginia, DC-MD-VA-WV CSA 8 Miami-Fort Lauderdale-Pompano Beach, FL MSA 5,564,635 5,007,564 +11.12% primary census statistical area 9 Atlanta-Sandy Springs-Marietta, GA MSA 5,268,860 4,247,981 +24.03% Atlanta-Sandy Springs-Gainesville, GA-AL CSA 10 Boston-Cambridge-Quincy, MA-NH MSA 4,552,402 4,391,344 +3.67% Boston-Worcester-Manchester, MA-RI-NH CSA 11 San Francisco-Oakland-Fremont, CA MSA 4,335,391 4,123,740 +5.13% San Jose-San Francisco-Oakland, CA CSA 12 Detroit-Warren-Livonia, MI MSA 4,296,250 4,452,557 −3.51% Detroit-Warren-Flint, MI CSA 13 Riverside-San Bernardino-Ontario, CA MSA 4,224,851 3,254,821 +29.80% Los Angeles-Long Beach-Riverside, CA CSA 14 Phoenix-Mesa-Glendale, AZ MSA 4,192,887 3,251,876 +28.94% primary census statistical area 15 Seattle-Tacoma-Bellevue, WA MSA 3,439,809 3,043,878 +13.01% Seattle-Tacoma-Olympia, WA CSA 16 Minneapolis-St. Paul-Bloomington, MN-WI MSA 3,317,308 2,968,806 +11.74% Minneapolis-St. Paul-St. Cloud, MN-WI CSA 17 San Diego-Carlsbad-San Marcos, CA MSA 3,095,313 2,813,833 +10.00% primary census statistical area 18 St. Louis, MO-IL MSA 2,812,896 2,698,687 +4.23% St. Louis-St. Charles-Farmington, MO-IL CSA 19 Tampa-St. Petersburg-Clearwater, FL MSA 2,783,243 2,395,997 +16.16% primary census statistical area 20 Baltimore-Towson, MD MSA 2,710,489 2,552,994 +6.17% Washington-Baltimore-Northern Virginia, DC-MD-VA-WV CSA 21 Denver-Aurora-Broomfield, CO MSA 2,543,482 2,179,240 +16.71% Denver-Aurora-Boulder, CO CSA 22 Pittsburgh, PA MSA 2,356,285 2,431,087 −3.08% Pittsburgh-New Castle, PA CSA 23 Portland-Vancouver-Hillsboro, OR-WA MSA 2,226,009 1,927,881 +15.46% primary census statistical area 24 Sacramento–Arden-Arcade–Roseville, CA MSA 2,149,127 1,796,857 +19.60% Sacramento–Arden-Arcade–Yuba City, CA-NV CSA 25 San Antonio-New Braunfels, TX MSA 2,142,508 1,711,703 +25.17% primary census statistical area 26 Orlando-Kissimmee-Sanford, FL MSA 2,134,411 1,644,561 +29.79% Orlando-Deltona-Daytona Beach, FL CSA 27 Cincinnati-Middletown, OH-KY-IN MSA 2,130,151 2,009,632 +6.00% Cincinnati-Middletown-Wilmington, OH-KY-IN CSA 28 Cleveland-Elyria-Mentor, OH MSA 2,077,240 2,148,143 −3.30% Cleveland-Akron-Elyria, OH CSA 29 Kansas City, MO-KS MSA 2,035,334 1,836,038 +10.85% Kansas City-Overland Park-Kansas City, MO-KS CSA 30 Las Vegas-Paradise, NV MSA 1,951,269 1,375,765 +41.83% Las Vegas-Paradise-Pahrump, NV CSA 31 San Jose-Sunnyvale-Santa Clara, CA MSA 1,836,911 1,735,819 +5.82% San Jose-San Francisco-Oakland, CA CSA 32 Columbus, OH MSA 1,836,536 1,612,694 +13.88% Columbus-Marion-Chillicothe, OH CSA 33 Charlotte-Gastonia-Rock Hill, NC-SC MSA 1,758,038 1,330,448 +32.14% Charlotte-Gastonia-Salisbury, NC-SC CSA 34 Indianapolis-Carmel, IN MSA 1,756,241 1,525,104 +15.16% Indianapolis-Anderson-Columbus, IN CSA 35 Austin-Round Rock-San Marcos, TX MSA 1,716,289 1,249,763 +37.33% Austin-Round Rock-Marble Falls, TX CSA 36 Virginia Beach-Norfolk-Newport News, VA-NC MSA 1,671,683 1,576,370 +6.05% primary census statistical area 37 Providence-New Bedford-Fall River, RI-MA MSA 1,600,852 1,582,997 +1.13% Boston-Worcester-Manchester, MA-RI-NH CSA 38 Nashville-Davidson–Murfreesboro–Franklin, TN MSA 1,589,934 1,311,789 +21.20% Nashville-Davidson–Murfreesboro–Columbia, TN CSA 39 Milwaukee-Waukesha-West Allis, WI MSA 1,555,908 1,500,741 +3.68% Milwaukee-Racine-Waukesha, WI CSA 40 Jacksonville, FL MSA 1,345,596 1,122,750 +19.85% primary census statistical area 41 Memphis, TN-MS-AR MSA 1,316,100 1,205,204 +9.20% primary census statistical area 42 Louisville/Jefferson County, KY-IN MSA 1,307,647 1,161,975 +12.54% Louisville/Jefferson County–Elizabethtown–Scottsburg, KY-IN CSA 43 Richmond, VA MSA 1,258,251 1,096,957 +14.70% primary census statistical area 44 Oklahoma City, OK MSA 1,252,987 1,095,421 +14.38% Oklahoma City-Shawnee, OK CSA 45 Hartford-West Hartford-East Hartford, CT MSA 1,212,381 1,148,618 +5.55% Hartford-West Hartford-Willimantic, CT CSA 46 New Orleans-Metairie-Kenner, LA MSA 1,167,764 1,316,510 −11.30% New Orleans-Metairie-Bogalusa, LA CSA 47 Buffalo-Niagara Falls, NY MSA 1,135,509 1,170,111 −2.96% Buffalo-Niagara-Cattaraugus, NY CSA 48 Raleigh-Cary, NC MSA 1,130,490 797,071 +41.83% Raleigh-Durham-Cary, NC CSA 49 Birmingham-Hoover, AL MSA 1,128,047 1,052,238 +7.20% Birmingham-Hoover-Cullman, AL CSA 50 Salt Lake City, UT MSA 1,124,197 968,858 +16.03% Salt Lake City-Ogden-Clearfield, UT CSA 51 Rochester, NY MSA 1,054,323 1,037,831 +1.59% Rochester-Batavia-Seneca Falls, NY CSA 52 Tucson, AZ MSA 980,263 843,746 +16.18% primary census statistical area 53 Honolulu, HI MSA 953,207 876,156 +8.79% primary census statistical area 54 Tulsa, OK MSA 937,478 859,532 +9.07% Tulsa-Bartlesville, OK CSA 55 Fresno, CA MSA 930,450 799,407 +16.39% Fresno-Madera, CA CSA 56 Bridgeport-Stamford-Norwalk, CT MSA 916,829 882,567 +3.88% New York-Newark-Bridgeport, NY-NJ-CT-PA CSA 57 Albuquerque, NM MSA 907,755 729,649 +24.41% primary census statistical area 58 Albany-Schenectady-Troy, NY MSA 870,716 825,875 +5.43% Albany-Schenectady-Amsterdam, NY CSA 59 Omaha-Council Bluffs, NE-IA MSA 865,350 767,041 +12.82% Omaha-Council Bluffs-Fremont, NE-IA CSA 60 New Haven-Milford, CT MSA 862,477 824,008 +4.67% New York-Newark-Bridgeport, NY-NJ-CT-PA CSA 61 Dayton, OH MSA 841,502 848,153 −0.78% Dayton-Springfield-Greenville, OH CSA 62 Bakersfield-Delano, CA MSA 839,631 661,645 +26.90% primary census statistical area 63 Oxnard-Thousand Oaks-Ventura, CA MSA 823,318 753,197 +9.31% Los Angeles-Long Beach-Riverside, CA CSA 64 Allentown-Bethlehem-Easton, PA-NJ MSA 821,173 740,395 +10.91% primary census statistical area 65 Baton Rouge, LA MSA 802,484 705,973 +13.67% Baton Rouge-Pierre Part, LA CSA 66 El Paso, TX MSA 800,647 679,622 +17.81% primary census statistical area 67 Worcester, MA MSA 798,552 750,963 +6.34% Boston-Worcester-Manchester, MA-RI-NH CSA 68 McAllen-Edinburg-Mission, TX MSA 774,769 569,463 +36.05% primary census statistical area 69 Grand Rapids-Wyoming, MI MSA 774,160 740,482 +4.55% Grand Rapids-Muskegon-Holland, MI CSA 70 Columbia, SC MSA 767,598 647,158 +18.61% Columbia-Newberry, SC CSA 71 Greensboro-High Point, NC MSA 723,801 643,430 +12.49% Greensboro–Winston-Salem–High Point, NC CSA 72 Akron, OH MSA 703,200 694,960 +1.19% Cleveland-Akron-Elyria, OH CSA 73 North Port-Bradenton-Sarasota, FL MSA 702,281 589,959 +19.04% Sarasota-Bradenton-Punta Gorda, FL CSA 74 Little Rock-North Little Rock-Conway, AR MSA 699,757 610,518 +14.62% Little Rock-North Little Rock-Pine Bluff, AR CSA 75 Knoxville, TN MSA 698,030 616,079 +13.30% Knoxville-Sevierville-La Follette, TN CSA 76 Springfield, MA MSA 692,942 680,014 +1.90% primary census statistical area 77 Stockton, CA MSA 685,306 563,598 +21.59% primary census statistical area 78 Poughkeepsie-Newburgh-Middletown, NY MSA 670,301 621,517 +7.85% New York-Newark-Bridgeport, NY-NJ-CT-PA CSA 79 Charleston-North Charleston-Summerville, SC MSA 664,607 549,033 +21.05% primary census statistical area 80 Syracuse, NY MSA 662,577 650,154 +1.91% Syracuse-Auburn, NY CSA 81 Toledo, OH MSA 651,429 659,188 −1.18% Toledo-Fremont, OH CSA 82 Colorado Springs, CO MSA 645,613 537,484 +20.12% primary census statistical area 83 Greenville-Mauldin-Easley, SC MSA 636,986 559,940 +13.76% Greenville-Spartanburg-Anderson, SC CSA 84 Wichita, KS MSA 623,061 571,166 +9.09% Wichita-Winfield, KS CSA 85 Cape Coral-Fort Myers, FL MSA 618,754 440,888 +40.34% primary census statistical area 86 Boise City-Nampa, ID MSA 616,561 464,840 +32.64% primary census statistical area 87 Lakeland-Winter Haven, FL MSA 602,095 483,924 +24.42% primary census statistical area 88 Des Moines-West Des Moines, IA MSA 569,633 481,394 +18.33% Des Moines-Newton-Pella, IA CSA 89 Madison, WI MSA 568,593 501,774 +13.32% Madison-Baraboo, WI CSA 90 Youngstown-Warren-Boardman, OH-PA MSA 565,773 602,964 −6.17% Youngstown-Warren-East Liverpool, OH-PA CSA 91 Scranton–Wilkes-Barre, PA MSA 563,631 560,625 +0.54% primary census statistical area 92 Augusta-Richmond County, GA-SC MSA 556,877 499,684 +11.45% primary census statistical area 93 Harrisburg-Carlisle, PA MSA 549,475 509,074 +7.94% Harrisburg-Carlisle-Lebanon, PA CSA 94 Ogden-Clearfield, UT MSA 547,184 442,656 +23.61% Salt Lake City-Ogden-Clearfield, UT CSA 95 Palm Bay-Melbourne-Titusville, FL MSA 543,376 476,230 +14.10% primary census statistical area 96 Jackson, MS MSA 539,057 497,197 +8.42% Jackson-Yazoo City, MS CSA 97 Chattanooga, TN-GA MSA 528,143 476,531 +10.83% Chattanooga-Cleveland-Athens, TN-GA CSA 98 Provo-Orem, UT MSA 526,810 376,774 +39.82% primary census statistical area 99 Lancaster, PA MSA 519,445 470,658 +10.37% primary census statistical area 100 Modesto, CA MSA 514,453 446,997 +15.09% primary census statistical area 101 Portland-South Portland-Biddeford, ME MSA 514,098 487,568 +5.44% Portland-Lewiston-South Portland, ME CSA 102 Durham-Chapel Hill, NC MSA 504,357 426,493 +18.26% Raleigh-Durham-Cary, NC CSA 103 Deltona-Daytona Beach-Ormond Beach, FL MSA 494,593 443,343 +11.56% Orlando-Deltona-Daytona Beach, FL CSA 104 Santa Rosa-Petaluma, CA MSA 483,878 458,614 +5.51% San Jose-San Francisco-Oakland, CA CSA 105 Winston-Salem, NC MSA 477,717 421,961 +13.21% Greensboro–Winston-Salem–High Point, NC CSA 106 Lexington-Fayette, KY MSA 472,099 408,326 +15.62% Lexington-Fayette–Frankfort–Richmond, KY CSA 107 Spokane, WA MSA 471,221 417,939 +12.75% primary census statistical area 108 Lansing-East Lansing, MI MSA 464,036 447,728 +3.64% Lansing-East Lansing-Owosso, MI CSA 109 Fayetteville-Springdale-Rogers, AR-MO MSA 463,204 347,045 +33.47% primary census statistical area 110 Pensacola-Ferry Pass-Brent, FL MSA 448,991 412,153 +8.94% primary census statistical area 111 Visalia-Porterville, CA MSA 442,179 368,021 +20.15% primary census statistical area 112 Springfield, MO MSA 436,712 368,374 +18.55% primary census statistical area 113 York-Hanover, PA MSA 434,972 381,751 +13.94% York-Hanover-Gettysburg, PA CSA 114 Corpus Christi, TX MSA 428,185 403,280 +6.18% Corpus Christi-Kingsville, TX CSA 115 Flint, MI MSA 425,790 436,141 −2.37% Detroit-Warren-Flint, MI CSA 116 Reno-Sparks, NV MSA 425,417 342,885 +24.07% Reno-Sparks-Fernley, NV CSA 117 Asheville, NC MSA 424,858 369,171 +15.08% Asheville-Brevard, NC CSA 118 Port St. Lucie, FL MSA 424,107 319,426 +32.77% Port St. Lucie-Sebastian-Vero Beach, FL CSA 119 Santa Barbara-Santa Maria-Goleta, CA MSA 423,895 399,347 +6.15% primary census statistical area 120 Huntsville, AL MSA 417,593 342,376 +21.97% Huntsville-Decatur, AL CSA 121 Fort Wayne, IN MSA 416,257 390,156 +6.69% Fort Wayne-Huntington-Auburn, IN CSA 122 Salinas, CA MSA 415,057 401,762 +3.31% primary census statistical area 123 Vallejo-Fairfield, CA MSA 413,344 394,542 +4.77% San Jose-San Francisco-Oakland, CA CSA 124 Mobile, AL MSA 412,992 399,843 +3.29% Mobile-Daphne-Fairhope, AL CSA 125 Reading, PA MSA 411,442 373,638 +10.12% Philadelphia-Camden-Vineland, PA-NJ-DE-MD CSA 126 Brownsville-Harlingen, TX MSA 406,220 335,227 +21.18% Brownsville-Harlingen-Raymondville, TX CSA 127 Killeen-Temple-Fort Hood, TX MSA 405,300 330,714 +22.55% primary census statistical area 128 Canton-Massillon, OH MSA 404,422 406,934 −0.62% primary census statistical area 129 Manchester-Nashua, NH MSA 400,721 380,841 +5.22% Boston-Worcester-Manchester, MA-RI-NH CSA 130 Shreveport-Bossier City, LA MSA 398,604 375,965 +6.02% Shreveport-Bossier City-Minden, LA CSA 131 Salem, OR MSA 390,738 347,214 +12.54% primary census statistical area 132 Beaumont-Port Arthur, TX MSA 388,745 385,090 +0.95% primary census statistical area 133 Anchorage, AK MSA 380,821 319,605 +19.15% primary census statistical area 134 Davenport-Moline-Rock Island, IA-IL MSA 379,690 376,019 +0.98% primary census statistical area 135 Peoria, IL MSA 379,186 366,899 +3.35% Peoria-Canton, IL CSA 136 Montgomery, AL MSA 374,536 346,528 +8.08% Montgomery-Alexander City, AL CSA 137 Tallahassee, FL MSA 367,413 320,304 +14.71% primary census statistical area 138 Trenton-Ewing, NJ MSA 366,513 350,761 +4.49% New York-Newark-Bridgeport, NY-NJ-CT-PA CSA 139 Fayetteville, NC MSA 366,383 336,609 +8.85% primary census statistical area 140 Hickory-Lenoir-Morganton, NC MSA 365,497 341,851 +6.92% primary census statistical area 141 Wilmington, NC MSA 362,315 274,532 +31.98% primary census statistical area 142 Evansville, IN-KY MSA 358,676 342,815 +4.63% primary census statistical area 143 Eugene-Springfield, OR MSA 351,715 322,959 +8.90% primary census statistical area 144 Rockford, IL MSA 349,431 320,204 +9.13% Rockford-Freeport-Rochelle, IL CSA 145 Savannah, GA MSA 347,611 293,000 +18.64% Savannah-Hinesville-Fort Stewart, GA CSA 146 Ann Arbor, MI MSA 344,791 322,895 +6.78% Detroit-Warren-Flint, MI CSA 147 Ocala, FL MSA 331,298 258,916 +27.96% primary census statistical area 148 Kalamazoo-Portage, MI MSA 326,589 314,866 +3.72% primary census statistical area 149 Naples-Marco Island, FL MSA 321,520 251,377 +27.90% primary census statistical area 150 South Bend-Mishawaka, IN-MI MSA 319,224 316,663 +0.81% South Bend-Elkhart-Mishawaka, IN-MI CSA 151 Kingsport-Bristol-Bristol, TN-VA MSA 309,544 298,484 +3.71% Johnson City-Kingsport-Bristol (Tri-Cities), TN-VA CSA 152 Roanoke, VA MSA 308,707 288,309 +7.08% primary census statistical area 153 Green Bay, WI MSA 306,241 282,599 +8.37% primary census statistical area 154 Charleston, WV MSA 304,284 309,635 −1.73% primary census statistical area 155 Lincoln, NE MSA 302,157 266,787 +13.26% primary census statistical area 156 Fort Collins-Loveland, CO MSA 299,630 251,494 +19.14% primary census statistical area 157 Utica-Rome, NY MSA 299,397 299,896 −0.17% primary census statistical area 158 Fort Smith, AR-OK MSA 298,592 273,170 +9.31% primary census statistical area 159 Columbus, GA-AL MSA 294,865 281,768 +4.65% Columbus-Auburn-Opelika, GA-AL CSA 160 Boulder, CO MSA 294,567 269,814 +9.17% Denver-Aurora-Boulder, CO CSA 151 Huntington-Ashland, WV-KY-OH MSA 287,702 288,649 −0.33% primary census statistical area 162 Lubbock, TX MSA 284,890 249,700 +14.09% Lubbock-Levelland, TX CSA 163 Spartanburg, SC MSA 284,307 253,791 +12.02% Greenville-Spartanburg-Anderson, SC CSA 164 Erie, PA MSA 280,566 280,843 −0.10% primary census statistical area 165 Duluth, MN-WI MSA 279,771 275,486 +1.56% primary census statistical area 166 Atlantic City-Hammonton, NJ MSA 274,549 252,552 +8.71% primary census statistical area 167 Norwich-New London, CT MSA 274,055 259,088 +5.78% primary census statistical area 168 Clarksville, TN-KY MSA 273,949 232,000 +18.08% primary census statistical area 169 Lafayette, LA MSA 273,738 239,086 +14.49% Lafayette-Acadiana, LA CSA 170 San Luis Obispo-Paso Robles, CA MSA 269,637 246,681 +9.31% primary census statistical area 171 Myrtle Beach-North Myrtle Beach-Conway, SC MSA 269,291 196,629 +36.95% Myrtle Beach-Conway-Georgetown, SC CSA 172 Hagerstown-Martinsburg, MD-WV MSA 269,140 222,771 +20.81% primary census statistical area 173 Gainesville, FL MSA 264,275 232,392 +13.72% primary census statistical area 174 Holland-Grand Haven, MI MSA 263,801 238,314 +10.69% Grand Rapids-Muskegon-Holland, MI CSA 175 Santa Cruz-Watsonville, CA MSA 262,382 255,602 +2.65% San Jose-San Francisco-Oakland, CA CSA 176 Cedar Rapids, IA MSA 257,940 237,230 +8.73% primary census statistical area 177 Merced, CA MSA 255,793 210,554 +21.49% primary census statistical area 178 Kennewick-Pasco-Richland, WA MSA 253,340 191,822 +32.07% primary census statistical area 179 Greeley, CO MSA 252,825 180,926 +39.74% Denver-Aurora-Boulder, CO CSA 180 Lynchburg, VA MSA 252,634 228,616 +10.51% primary census statistical area 181 Olympia, WA MSA 252,264 207,355 +21.66% Seattle-Tacoma-Olympia, WA CSA 182 Binghamton, NY MSA 251,725 252,320 −0.24% primary census statistical area 183 Bremerton-Silverdale, WA MSA 251,133 231,969 +8.26% Seattle-Tacoma-Olympia, WA CSA 184 Laredo, TX MSA 250,304 193,117 +29.61% primary census statistical area 185 Amarillo, TX MSA 249,881 226,522 +10.31% primary census statistical area 186 Gulfport-Biloxi, MS MSA 248,820 246,190 +1.07% Gulfport-Biloxi-Pascagoula, MS CSA 187 Yakima, WA MSA 243,231 222,581 +9.28% primary census statistical area 188 Waco, TX MSA 234,906 213,517 +10.02% primary census statistical area 189 Topeka, KS MSA 233,870 224,551 +4.15% primary census statistical area 190 Macon, GA MSA 232,293 222,368 +4.46% Macon-Warner Robins-Fort Valley, GA CSA 191 Champaign-Urbana, IL MSA 231,891 210,275 +10.28% primary census statistical area 192 College Station-Bryan, TX MSA 228,660 184,885 +23.68% primary census statistical area 193 Sioux Falls, SD MSA 228,261 187,093 +22.00% primary census statistical area 194 Appleton, WI MSA 225,666 201,602 +11.94% Appleton-Oshkosh-Neenah, WI CSA 195 Chico, CA MSA 220,000 203,171 +8.28% primary census statistical area 196 Tuscaloosa, AL MSA 219,461 192,034 +14.28% primary census statistical area 197 Barnstable Town, MA MSA 215,888 222,230 −2.85% primary census statistical area 198 Longview, TX MSA 214,369 194,042 +10.48% Longview-Marshall, TX CSA 199 Burlington-South Burlington, VT MSA 211,261 198,889 +6.22% primary census statistical area 200 Prescott, AZ MSA 211,033 167,517 +25.98% primary census statistical area 201 Springfield, IL MSA 210,170 201,437 +4.34% primary census statistical area 202 Tyler, TX MSA 209,714 174,706 +20.04% Tyler-Jacksonville, TX CSA 203 Las Cruces, NM MSA 209,223 174,682 +19.77% primary census statistical area 204 Fargo, ND-MN MSA 208,777 174,367 +19.73% Fargo-Wahpeton, ND-MN CSA 205 Houma-Bayou Cane-Thibodaux, LA MSA 208,178 194,477 +7.05% primary census statistical area 206 Florence, SC MSA 205,566 193,155 +6.43% primary census statistical area 207 Medford, OR MSA 203,206 181,269 +12.10% primary census statistical area 208 Lafayette, IN MSA 201,789 178,541 +13.02% Lafayette-Frankfort, IN CSA 209 Charlottesville, VA MSA 201,559 174,021 +15.82% primary census statistical area 210 Bellingham, WA MSA 201,140 166,814 +20.58% primary census statistical area 211 Lake Havasu City-Kingman, AZ MSA 200,186 155,032 +29.13% primary census statistical area 212 Saginaw-Saginaw Township North, MI MSA 200,169 210,039 −4.70% Saginaw-Bay City-Saginaw Township North, MI CSA 213 Lake Charles, LA MSA 199,607 193,568 +3.12% Lake Charles-Jennings, LA CSA 214 Johnson City, TN MSA 198,716 181,607 +9.42% Johnson City-Kingsport-Bristol (Tri-Cities), TN-VA CSA 215 Elkhart-Goshen, IN MSA 197,559 182,791 +8.08% South Bend-Elkhart-Mishawaka, IN-MI CSA 216 Yuma, AZ MSA 195,751 160,026 +22.32% primary census statistical area 217 Racine, WI MSA 195,408 188,831 +3.48% Milwaukee-Racine-Waukesha, WI CSA 218 Bloomington, IN MSA 192,714 175,506 +9.80% primary census statistical area 219 Athens-Clarke County, GA MSA 192,541 166,079 +15.93% primary census statistical area 220 Greenville, NC MSA 189,510 152,772 +24.05% primary census statistical area 221 St. Cloud, MN MSA 189,093 167,392 +12.96% Minneapolis-St. Paul-St. Cloud, MN-WI CSA 222 Anderson, SC MSA 187,126 165,740 +12.90% Greenville-Spartanburg-Anderson, SC CSA 223 Rochester, MN MSA 186,011 163,618 +13.69% primary census statistical area 224 Kingston, NY MSA 182,493 177,749 +2.67% New York-Newark-Bridgeport, NY-NJ-CT-PA CSA 225 Crestview-Fort Walton Beach-Destin, FL MSA 180,822 170,498 +6.06% primary census statistical area 226 Gainesville, GA MSA 179,684 139,277 +29.01% Atlanta-Sandy Springs-Gainesville, GA-AL CSA 227 Jacksonville, NC MSA 177,772 150,355 +18.23% primary census statistical area 228 Redding, CA MSA 177,223 163,256 +8.56% primary census statistical area 229 Monroe, LA MSA 176,441 170,053 +3.76% Monroe-Bastrop, LA CSA 230 Joplin, MO MSA 175,518 157,322 +11.57% primary census statistical area 231 El Centro, CA MSA 174,528 142,361 +22.60% primary census statistical area 232 Columbia, MO MSA 172,786 145,666 +18.62% primary census statistical area 233 Terre Haute, IN MSA 172,425 170,943 +0.87% primary census statistical area 234 Muskegon-Norton Shores, MI MSA 172,188 170,200 +1.17% Grand Rapids-Muskegon-Holland, MI CSA 235 Bloomington-Normal, IL MSA 169,572 150,433 +12.72% primary census statistical area 236 Panama City-Lynn Haven-Panama City Beach, FL MSA 168,852 148,217 +13.92% primary census statistical area 237 Waterloo-Cedar Falls, IA MSA 167,819 163,706 +2.51% primary census statistical area 238 Oshkosh-Neenah, WI MSA 166,994 156,763 +6.53% Appleton-Oshkosh-Neenah, WI CSA 239 Yuba City, CA MSA 166,892 139,149 +19.94% Sacramento–Arden-Arcade–Yuba City, CA-NV CSA 240 Abilene, TX MSA 165,252 160,245 +3.12% primary census statistical area 241 Blacksburg-Christiansburg-Radford, VA MSA 162,958 151,272 +7.73% primary census statistical area 242 Dover, DE MSA 162,310 126,697 +28.11% primary census statistical area 243 Pascagoula, MS MSA 162,246 150,564 +7.76% Gulfport-Biloxi-Pascagoula, MS CSA 244 Parkersburg-Marietta-Vienna, WV-OH MSA 162,056 164,624 −1.56% primary census statistical area 245 Eau Claire, WI MSA 161,151 148,337 +8.64% Eau Claire-Menomonie, WI CSA 246 Janesville, WI MSA 160,331 152,307 +5.27% primary census statistical area 247 Jackson, MI MSA 160,248 158,422 +1.15% primary census statistical area 248 Punta Gorda, FL MSA 159,978 141,627 +12.96% Sarasota-Bradenton-Punta Gorda, FL CSA 249 Pueblo, CO MSA 159,063 141,472 +12.43% primary census statistical area 250 Billings, MT MSA 158,050 138,904 +13.78% primary census statistical area 251 Bend, OR MSA 157,733 115,367 +36.72% Bend-Prineville, OR CSA 252 Albany, GA MSA 157,308 157,833 −0.33% primary census statistical area 253 Vineland-Millville-Bridgeton, NJ MSA 156,898 146,438 +7.14% Philadelphia-Camden-Vineland, PA-NJ-DE-MD CSA 254 Niles-Benton Harbor, MI MSA 156,813 162,453 −3.47% primary census statistical area 255 State College, PA MSA 153,990 135,758 +13.43% primary census statistical area 256 Bangor, ME MSA 153,923 144,919 +6.21% primary census statistical area 257 Alexandria, LA MSA 153,922 145,035 +6.13% primary census statistical area 258 Decatur, AL MSA 153,829 145,867 +5.46% Huntsville-Decatur, AL CSA 259 Hanford-Corcoran, CA MSA 152,982 129,461 +18.17% primary census statistical area 260 Iowa City, IA MSA 152,586 131,676 +15.88% primary census statistical area 261 Rocky Mount, NC MSA 152,392 143,026 +6.55% primary census statistical area 262 Monroe, MI MSA 152,021 145,945 +4.16% Detroit-Warren-Flint, MI CSA 263 Wichita Falls, TX MSA 151,306 151,524 −0.14% primary census statistical area 264 Burlington, NC MSA 151,131 130,800 +15.54% Greensboro–Winston-Salem–High Point, NC CSA 265 Madera-Chowchilla, CA MSA 150,865 123,109 +22.55% Fresno-Madera, CA CSA 266 Jefferson City, MO MSA 149,807 140,052 +6.97% primary census statistical area 267 Wheeling, WV-OH MSA 147,950 153,172 −3.41% primary census statistical area 268 Florence-Muscle Shoals, AL MSA 147,137 142,950 +2.93% primary census statistical area 269 Grand Junction, CO MSA 146,723 116,255 +26.21% primary census statistical area 270 Dothan, AL MSA 145,639 130,861 +11.29% Dothan-Enterprise-Ozark, AL CSA 271 Santa Fe, NM MSA 144,170 129,292 +11.51% Santa Fe-Espanola, NM CSA 272 Johnstown, PA MSA 143,679 152,598 −5.84% primary census statistical area 273 Sioux City, IA-NE-SD MSA 143,577 143,053 +0.37% Sioux City-Vermillion, IA-NE-SD CSA 274 Hattiesburg, MS MSA 142,842 123,812 +15.37% primary census statistical area 275 Dalton, GA MSA 142,227 120,031 +18.49% primary census statistical area 276 Auburn-Opelika, AL MSA 140,247 115,092 +21.86% Columbus-Auburn-Opelika, GA-AL CSA 277 Warner Robins, GA MSA 139,900 110,765 +26.30% Macon-Warner Robins-Fort Valley, GA CSA 278 Valdosta, GA MSA 139,588 119,560 +16.75% primary census statistical area 279 Coeur d'Alene, ID MSA 138,494 108,685 +27.43% primary census statistical area 280 Springfield, OH MSA 138,333 144,742 −4.43% Dayton-Springfield-Greenville, OH CSA 281 St. George, UT MSA 138,115 90,354 +52.86% primary census statistical area 282 Sebastian-Vero Beach, FL MSA 138,028 112,947 +22.21% Port St. Lucie-Sebastian-Vero Beach, FL CSA 283 Odessa, TX MSA 137,130 121,123 +13.22% Midland-Odessa, TX CSA 284 Midland, TX MSA 136,872 116,009 +17.98% Midland-Odessa, TX CSA 285 Morristown, TN MSA 136,608 123,081 +10.99% Knoxville-Sevierville-La Follette, TN CSA 286 Napa, CA MSA 136,484 124,279 +9.82% San Jose-San Francisco-Oakland, CA CSA 287 Battle Creek, MI MSA 136,146 137,985 −1.33% primary census statistical area 288 Texarkana, TX-Texarkana, AR MSA 136,027 129,749 +4.84% primary census statistical area 289 Flagstaff, AZ MSA 134,421 116,320 +15.56% primary census statistical area 290 Wausau, WI MSA 134,063 125,834 +6.54% Wausau-Merrill, WI CSA 291 La Crosse, WI-MN MSA 133,665 126,838 +5.38% primary census statistical area 292 Lebanon, PA MSA 133,568 120,327 +11.00% Harrisburg-Carlisle-Lebanon, PA CSA 293 Anderson, IN MSA 131,636 133,358 −1.29% Indianapolis-Anderson-Columbus, IN CSA 294 Pittsfield, MA MSA 131,219 134,953 −2.77% primary census statistical area 295 Idaho Falls, ID MSA 130,374 101,677 +28.22% Idaho Falls-Blackfoot, ID CSA 296 Farmington, NM MSA 130,044 113,801 +14.27% primary census statistical area 297 Morgantown, WV MSA 129,709 111,200 +16.64% primary census statistical area 298 Glens Falls, NY MSA 128,923 124,345 +3.68% Albany-Schenectady-Amsterdam, NY CSA 299 Winchester, VA-WV MSA 128,472 102,997 +24.73% Washington-Baltimore-Northern Virginia, DC-MD-VA-WV CSA 300 St. Joseph, MO-KS MSA 127,329 122,336 +4.08% primary census statistical area 301 Altoona, PA MSA 127,089 129,144 −1.59% primary census statistical area 302 Manhattan, KS MSA 127,081 108,999 +16.59% primary census statistical area 303 Rapid City, SD MSA 126,382 112,818 +12.02% primary census statistical area 304 Bowling Green, KY MSA 125,953 104,166 +20.92% primary census statistical area 305 Logan, UT-ID MSA 125,442 102,720 +22.12% primary census statistical area 306 Harrisonburg, VA MSA 125,228 108,193 +15.75% primary census statistical area 307 Salisbury, MD MSA 125,203 109,391 +14.45% Salisbury-Ocean Pines, MD CSA 308 Mansfield, OH MSA 124,475 128,852 −3.40% Mansfield-Bucyrus, OH CSA 309 Steubenville-Weirton, OH-WV MSA 124,454 132,008 −5.72% primary census statistical area 310 Lawton, OK MSA 124,098 114,996 +7.92% primary census statistical area 311 Goldsboro, NC MSA 122,623 113,329 +8.20% primary census statistical area 312 Jonesboro, AR MSA 121,026 107,762 +12.31% Jonesboro-Paragould, AR CSA 313 Sherman-Denison, TX MSA 120,877 110,595 +9.30% Dallas-Fort Worth, TX CSA 314 Elizabethtown, KY MSA 119,736 107,547 +11.33% Louisville/Jefferson County–Elizabethtown–Scottsburg, KY-IN CSA 315 Anniston-Oxford, AL MSA 118,572 112,249 +5.63% primary census statistical area 316 Muncie, IN MSA 117,671 118,769 −0.92% primary census statistical area 317 Mount Vernon-Anacortes, WA MSA 116,901 102,979 +13.52% Seattle-Tacoma-Olympia, WA CSA 318 Williamsport, PA MSA 116,111 120,044 −3.28% Williamsport-Lock Haven, PA CSA 319 Cleveland, TN MSA 115,788 104,015 +11.32% Chattanooga-Cleveland-Athens, TN-GA CSA 320 Sheboygan, WI MSA 115,507 112,646 +2.54% primary census statistical area 321 Jackson, TN MSA 115,425 107,377 +7.50% Jackson-Humboldt, TN CSA 322 Victoria, TX MSA 115,384 111,663 +3.33% primary census statistical area 323 Owensboro, KY MSA 114,752 109,875 +4.44% primary census statistical area 324 Kankakee-Bradley, IL MSA 113,449 103,833 +9.26% Chicago-Naperville-Michigan City, IL-IN-WI CSA 325 Brunswick, GA MSA 112,370 93,044 +20.77% primary census statistical area 326 San Angelo, TX MSA 111,823 105,781 +5.71% primary census statistical area 327 Michigan City-La Porte, IN MSA 111,467 110,106 +1.24% Chicago-Naperville-Michigan City, IL-IN-WI CSA 328 Wenatchee-East Wenatchee, WA MSA 110,884 99,219 +11.76% primary census statistical area 329 Lawrence, KS MSA 110,826 99,962 +10.87% primary census statistical area 330 Decatur, IL MSA 110,768 114,706 −3.43% primary census statistical area 331 Missoula, MT MSA 109,299 95,802 +14.09% primary census statistical area 332 Bismarck, ND MSA 108,779 94,719 +14.84% primary census statistical area 333 Bay City, MI MSA 107,771 110,157 −2.17% Saginaw-Bay City-Saginaw Township North, MI CSA 334 Lewiston-Auburn, ME MSA 107,702 103,793 +3.77% Portland-Lewiston-South Portland, ME CSA 335 Sumter, SC MSA 107,456 104,646 +2.69% primary census statistical area 336 Danville, VA MSA 106,561 110,156 −3.26% primary census statistical area 337 Lima, OH MSA 106,331 108,473 −1.97% Lima-Van Wert-Wapakoneta, OH CSA 338 Gadsden, AL MSA 104,430 103,459 +0.94% primary census statistical area 339 Cumberland, MD-WV MSA 103,299 102,008 +1.27% primary census statistical area 340 Longview, WA MSA 102,410 92,948 +10.18% primary census statistical area 341 Fond du Lac, WI MSA 101,633 97,296 +4.46% Fond du Lac-Beaver Dam, WI CSA 342 Ithaca, NY MSA 101,564 96,501 +5.25% Ithaca-Cortland, NY CSA 343 Pine Bluff, AR MSA 100,258 107,341 −6.60% Little Rock-North Little Rock-Pine Bluff, AR CSA 344 Kokomo, IN MSA 98,688 101,541 −2.81% Kokomo-Peru, IN CSA 345 Grand Forks, ND-MN MSA 98,461 97,478 +1.01% primary census statistical area 346 Fairbanks, AK MSA 97,581 82,840 +17.79% primary census statistical area 347 Ocean City, NJ MSA 97,265 102,326 −4.95% primary census statistical area 348 Mankato-North Mankato, MN MSA 96,740 85,712 +12.87% primary census statistical area 349 Rome, GA MSA 96,317 90,565 +6.35% primary census statistical area 350 Cape Girardeau-Jackson, MO-IL MSA 96,275 90,312 +6.60% Cape Girardeau-Sikeston-Jackson, MO-IL CSA 351 Hot Springs, AR MSA 96,024 88,068 +9.03% primary census statistical area 352 Palm Coast, FL MSA 95,696 49,832 +92.04% Orlando-Deltona-Daytona Beach, FL CSA 353 Dubuque, IA MSA 93,653 89,143 +5.06% primary census statistical area 354 Cheyenne, WY MSA 91,738 81,607 +12.41% primary census statistical area 355 Pocatello, ID MSA 90,656 83,103 +9.09% primary census statistical area 356 Ames, IA MSA 89,542 79,981 +11.95% Ames-Boone, IA CSA 357 Elmira, NY MSA 88,830 91,070 −2.46% primary census statistical area 358 Corvallis, OR MSA 85,579 78,153 +9.50% Albany-Corvallis-Lebanon, OR CSA 359 Danville, IL MSA 81,625 83,919 −2.73% primary census statistical area 360 Great Falls, MT MSA 81,327 80,357 +1.21% primary census statistical area 361 Hinesville-Fort Stewart, GA MSA 77,917 71,914 +8.35% Savannah-Hinesville-Fort Stewart, GA CSA 362 Sandusky, OH MSA 77,079 79,551 −3.11% primary census statistical area 363 Columbus, IN MSA 76,794 71,435 +7.50% Indianapolis-Anderson-Columbus, IN CSA 364 Casper, WY MSA 75,450 66,533 +13.40% primary census statistical area 365 Lewiston, ID-WA MSA 60,888 57,961 +5.05% primary census statistical area 366 Carson City, NV MSA 55,274 52,457 +5.37% primary census statistical area See also
 United States census statistical areas by state, district, or territoryASMPGUVI
- Geography
- United States
- United States Census Bureau
- United States Office of Management and Budget
- Combined Statistical Area
- Core Based Statistical Area
- Metropolitan Statistical Area
- Micropolitan Statistical Area
- United States urban area
- Demographics of the United States
- Table of United States Combined Statistical Areas (CSA)
- Table of United States Core Based Statistical Areas (CBSA)
- Table of United States Metropolitan Statistical Areas (MSA)
- Table of United States Micropolitan Statistical Areas (µSA)
- Table of United States primary census statistical areas (PCSA)
- List of United States urban areas
References
- ^ The United States Office of Management and Budget (OMB) defines a Metropolitan Statistical Area (MSA) as a Core Based Statistical Area having at least one urbanized area of 50,000 or more population, plus adjacent territory that has a high degree of social and economic integration with the core as measured by commuting ties. The OMB has defined 367 MSAs for the United States as of March 29, 2010.
- ^ a b c "OMB Bulletin No. 10-02: Update of Statistical Area Definitions and Guidance on Their Uses". United States Office of Management and Budget. December 1, 2009. http://www.whitehouse.gov/omb/assets/bulletins/b10-02.pdf. Retrieved March 29, 2010.
- ^ a b c d [http://factfinder2.census.gov/faces/tableservices/jsf/pages/productview.xhtml?pid=DEC_10_NSRD_GCTPL2.US24PR&prodType=table "Population and Housing Occupancy Status: 2010 - United States -- Metropolitan Statistical Area; and for Puerto Rico more information 2010 Census National Summary File of Redistricting Data"]. 2010 United States Census. United States Census Bureau, Population Division. April 14, 2011. http://factfinder2.census.gov/faces/tableservices/jsf/pages/productview.xhtml?pid=DEC_10_NSRD_GCTPL2.US24PR&prodType=table. Retrieved April 14, 2011.
- ^ The United States Office of Management and Budget (OMB) defines a Combined Statistical Area (CSA) as an aggregate of adjacent Core Based Statistical Areas that are linked by commuting ties. The OMB has defined 125 CSAs for the United States as of March 29, 2010.
External links
50 largest metropolitan statistical areas in the United States by population - New York
- Los Angeles
- Chicago
- Dallas–Fort Worth
- Philadelphia
- Houston
- Washington
- Miami
- Atlanta
- Boston
- Memphis
- Louisville
- Richmond
- Oklahoma City
- Hartford
- New Orleans
- Buffalo
- Raleigh
- Birmingham
- Salt Lake City
United States Censuses (Census Bureau)  Categories:
- Demographic lists
- Demographics of the United States
- Metropolitan areas of the United States
- United States Census Bureau geography


Wikimedia Foundation. 2010.