- Wealden (UK Parliament constituency)
-
Coordinates: 50°59′56″N 0°12′43″E / 50.999°N 0.212°E
Wealden
County constituency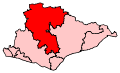
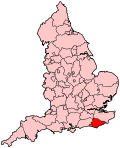
Wealden shown within East Sussex, and East Sussex shown within England Created: 1983 Electorate: 77,536 (December 2010) MP: Charles Hendry Party: Conservative Type: House of Commons County: East Sussex EP constituency: South East England Wealden is a county constituency covering the Wealden district in East Sussex. It is represented in the House of Commons of the Parliament of the United Kingdom.
Contents
Boundaries
Half of the population in the constituency lives in the area’s four main towns: Crowborough, Hailsham, Heathfield and Uckfield. The rest of the seat is predominantly rural and has many small towns, villages and hamlets. The Wealden landscape is varied, ranging from the Ashdown Forest in the north to the South Downs and the coast to the south.
The constituency covers much of the Wealden district of East Sussex. However, some of the district in the south falls into the constituencies of Lewes, Bexhill and Battle and Eastbourne.
Members of Parliament
Election Member [1] Party 1983 Sir Geoffrey Johnson Smith Conservative 2001 Charles Hendry Conservative Elections
Elections in the 2010s
General Election 2010: Wealden Party Candidate Votes % ±% Conservative Charles Hendry 31,090 56.6 +6.1 Liberal Democrat Chris Bowers 13,911 25.3 +0.6 Labour Lorna Blackmore 5,266 9.6 -7.1 UKIP Dan Docker 3,319 6.0 +2.2 Green David Jonas 1,383 2.5 -1.8 Majority 17,179 31.3 Turnout 54,969 71.8 +5.5 Conservative hold Swing +2.8% Elections in the 2000s
General Election 2005: Wealden Party Candidate Votes % ±% Conservative Charles Hendry 28,975 52.1 +2.3 Liberal Democrat Christopher Wigley 13,054 23.5 -0.2 Labour Dudley Rose 9,360 16.8 -3.5 Green Julian Salmon 2,150 3.9 +1.5 UKIP Keith Riddle 2,114 3.8 +0.9 Majority 15,921 28.6 Turnout 55,653 67.7 4.2 Conservative hold Swing +1.3 General Election 2001: Wealden Party Candidate Votes % ±% Conservative Charles Hendry 26,279 49.8 0.0 Liberal Democrat Steve Murphy 12,507 23.7 -2.0 Labour Kathy Fordham 10,705 20.3 +3.1 UKIP Keith Riddle 1,538 2.9 +2.0 Green Julian Salmon 1,273 2.4 N/A Pensioner Coalition Cyril Thornton 453 0.9 N/A Majority 13,772 26.1 Turnout 52,756 63.5 -10.2 Conservative hold Swing Elections in the 1990s
General Election 1997: Wealden Party Candidate Votes % ±% Conservative Geoffrey Johnson Smith 29,417 49.8 -12.0 Liberal Democrat Michael Skinner 15,213 25.7 -1.3 Labour Nicholas Levine 10,185 17.2 +8.0 Referendum Party Barry Taplin 3,527 6.0 N/A UKIP M J English 569 0.9 N/A Natural Law Paul Cragg 188 0.3 Majority 14,204 24.0 Turnout 59,099 73.7 Conservative hold Swing This constituency underwent boundary changes between the 1992 and 1997 general elections and thus change in share of vote is based on a notional calculation.
General Election 1992: Wealden[2] Party Candidate Votes % ±% Conservative Geoffrey Johnson Smith 37,263 61.7 -2.5 Liberal Democrat Michael Skinner 16,332 27.1 -0.4 Labour Steve Billcliffe 5,579 9.2 +0.9 Green Ian Guy-Moore 1,002 1.7 N/A Natural Law R F Graham 182 0.3 N/A Majority 20,931 34.6 −2.1 Turnout 60,358 81.0 +6.0 Conservative hold Swing −1.1 Elections in the 1980s
General Election 1987: Wealden Party Candidate Votes % ±% Conservative Geoffrey Johnson Smith 35,154 64.2 0.0 Social Democrat D A Sinclair 15,044 27.5 -2.1 Labour C E Ward 4,563 8.3 +2.1 Majority 20,110 36.7 Turnout 54,761 75.0 +3.2 Conservative hold Swing General Election 1983: Wealden Party Candidate Votes % ±% Conservative Geoffrey Johnson Smith 31,926 64.2 Social Democrat D E Pace 14,741 29.6 Labour P F L Knight 3,060 6.2 Majority 17,185 34.6 Turnout 49,727 71.8 See also
Notes and references
- ^ Leigh Rayment's Historical List of MPs – Constituencies beginning with "W" (part 2)
- ^ "Politics Resources". Election 1992. Politics Resources. 9 April 1992. http://www.politicsresources.net/area/uk/ge92/ge92index.htm. Retrieved 2010-12-06.
Sources
- Election result, 2010 (BBC)
- Election result, 2005 (BBC)
- Election results, 1997 - 2001 (BBC)
- Election results, 1997 - 2001 (Election Demon)
- Election results, 1983 - 1992 (Election Demon)
- Election results, 1992 - 2005 (Guardian)
Categories:- Parliamentary constituencies in South East England
- United Kingdom Parliamentary constituencies established in 1983
- Politics of East Sussex
- Wealden


Wikimedia Foundation. 2010.