- Precipitation (meteorology)
-
 Long-term mean precipitation by month
In meteorology, precipitation (also known as one of the classes of hydrometeors, which are atmospheric water phenomena is any product of the condensation of atmospheric water vapor that falls under gravity.[1] The main forms of precipitation include drizzle, rain, sleet, snow, graupel and hail. It occurs when a local portion of the atmosphere becomes saturated with water vapour and the water condenses.[2] Two processes, possibly acting together, can lead to air becoming saturated: cooling the air or adding water vapour to the air. Generally, precipitation will fall to the surface; an exception is Virga which evaporates before reaching the surface. Precipitation forms as smaller droplets coalesce via collision with other rain drops or ice crystals within a cloud. Rain drops range in size from oblate, pancake-like shapes for larger drops, to small spheres for smaller drops. Unlike raindrops, snowflakes grow in a variety of different shapes and patterns, determined by the temperature and humidity characteristics of the air the snowflake moves through on its way to the ground. While snow and ice pellets require temperatures close to the ground to be near or below freezing, hail can occur during much warmer temperature regimes due to the process of its formation.
Moisture overriding associated with weather fronts is an overall major method of precipitation production. If enough moisture and upward motion is present, precipitation falls from convective clouds such as cumulonimbus and can organize into narrow rainbands. Where relatively warm water bodies are present, for example due to water evaporation from lakes, lake-effect snowfall becomes a concern downwind of the warm lakes within the cold cyclonic flow around the backside of extratropical cyclones. Lake-effect snowfall can be locally heavy. Thundersnow is possible within a cyclone's comma head and within lake effect precipitation bands. In mountainous areas, heavy precipitation is possible where upslope flow is maximized within windward sides of the terrain at elevation. On the leeward side of mountains, desert climates can exist due to the dry air caused by compressional heating. The movement of the monsoon trough, or intertropical convergence zone, brings rainy seasons to savannah climes.
Precipitation is a major component of the water cycle, and is responsible for depositing the fresh water on the planet. Approximately 505,000 cubic kilometres (121,000 cu mi) of water falls as precipitation each year; 398,000 cubic kilometres (95,000 cu mi) of it over the oceans.[3] Given the Earth's surface area, that means the globally averaged annual precipitation is 990 millimetres (39 in). Climate classification systems such as the Köppen climate classification system use average annual rainfall to help differentiate between differing climate regimes. The urban heat island effect may lead to increased rainfall, both in amounts and intensity, downwind of cities. Global warming is also causing changes in the precipitation pattern globally. Precipitation may occur on other celestial bodies, e.g. when it gets cold, Mars has precipitation which most likely takes the form of ice needles, rather than rain or snow.[4]
Part of the Nature series on
WeatherCalendar seasons Spring · Summer
Tropical seasonsStorms Thunderstorm · Supercell
Downburst · Lightning
Tornado · Waterspout
Tropical cyclone (Hurricane)
Extratropical cyclone
Winter storm · Blizzard · Ice storm
Dust storm · Firestorm · CloudPrecipitation Drizzle · Rain · Snow · Graupel
Freezing rain · Ice pellets · HailTopics Meteorology · Climate
Weather forecasting
Heat wave · Air pollutionWeather portal Contents
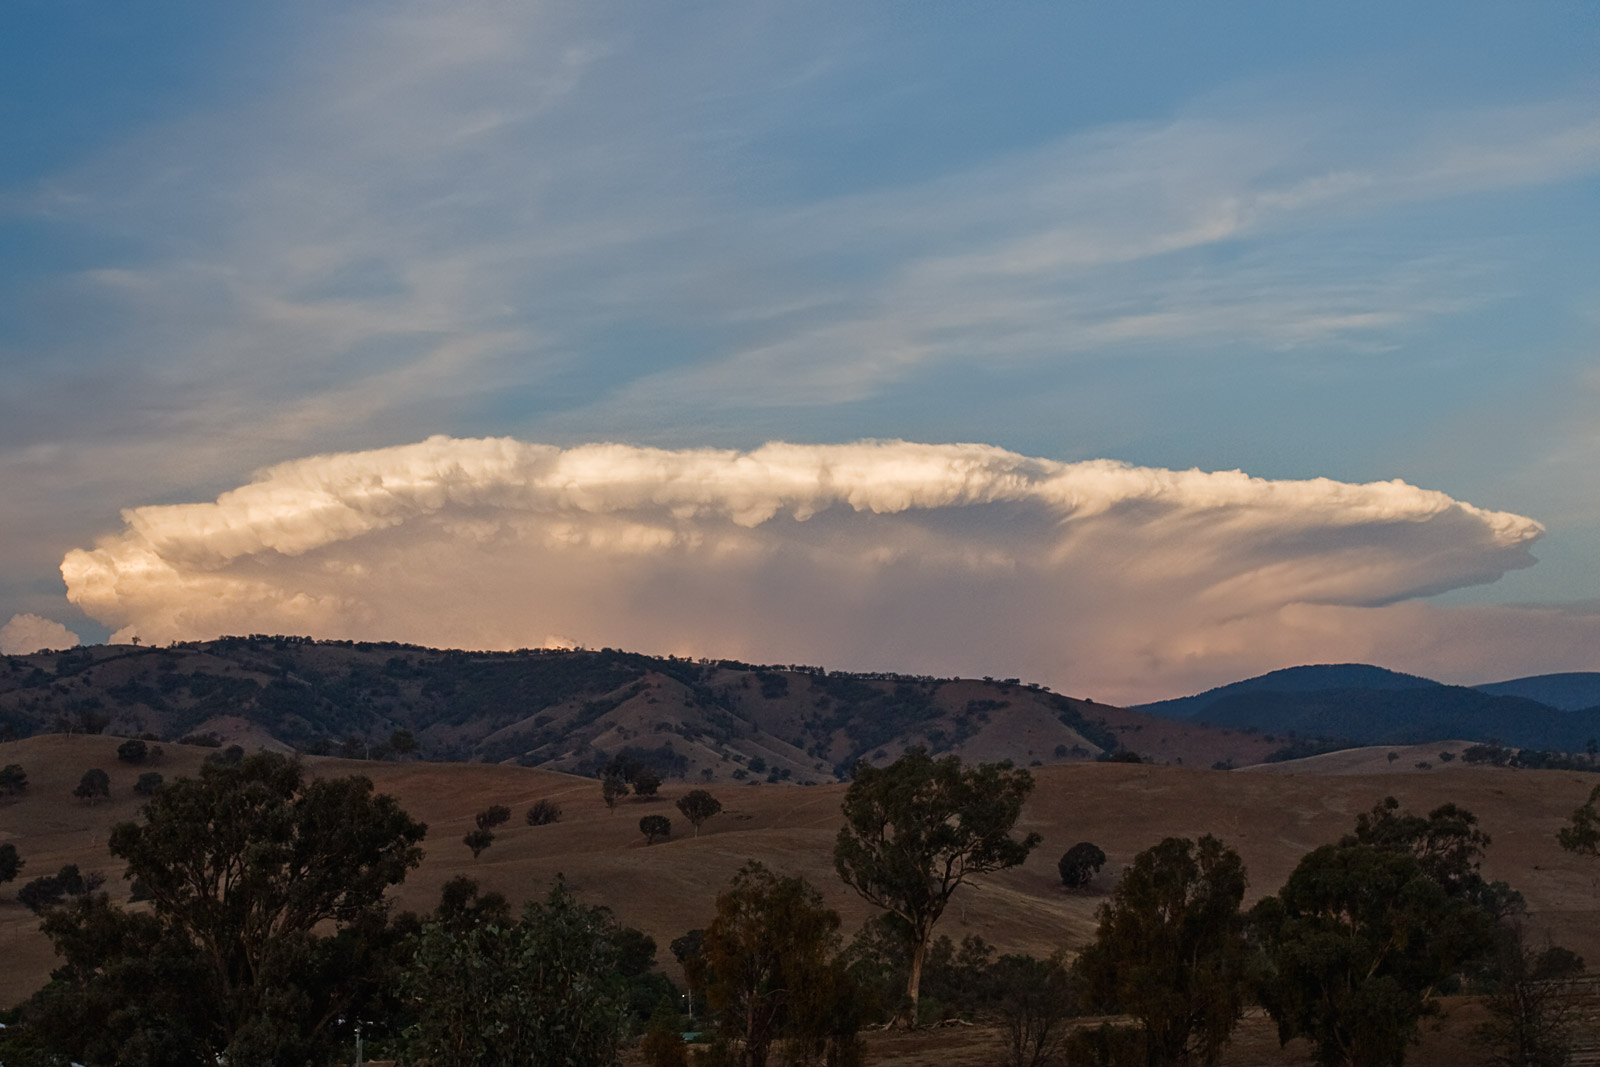
Hydrometeor
 This anvil-shaped Cumulonimbus incus cloud is composed of hydrometeors.
Any phenomenon which was at some point produced due to condensation or precipitation of moisture within the Earth's atmosphere is known as a hydrometeor. Particles composed of fallen precipitation which fell onto the Earth's surface can become hydrometeors if blown off the landscape by wind. Formations due to condensation such as clouds, haze, fog, and mist are composed of hydrometeors. All precipitation types are hydrometeors by definition, including virga, which is precipitation which evaporates before reaching the ground. Particles removed from the Earth's surface by wind such as blowing snow and blowing sea spray are also hydrometeors.[5]
Hydrometeors are unrelated to meteors, which are objects from outer space which have entered the Earth's atmosphere and have produced a light phenomenon.[6]
Types
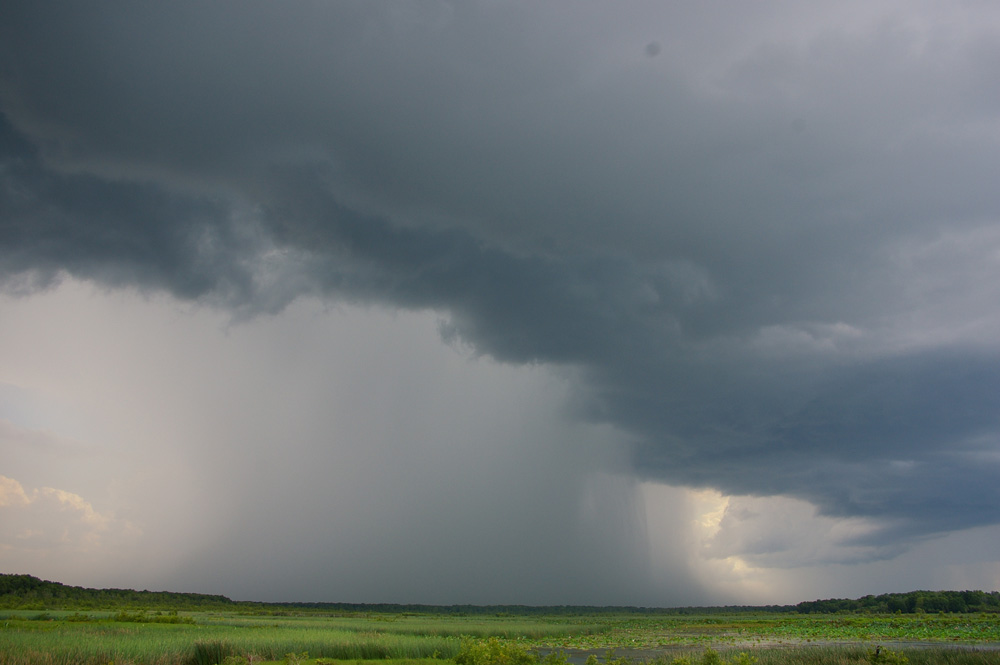
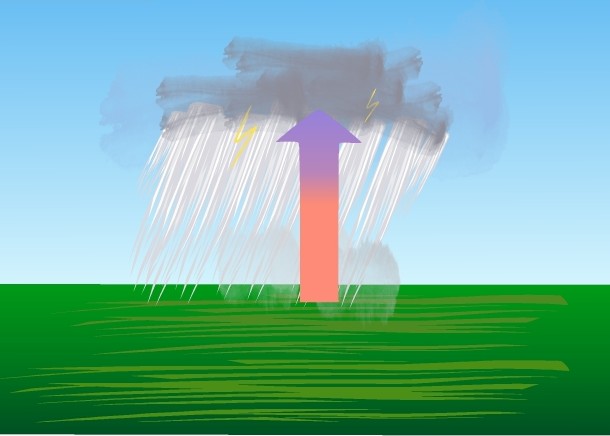
Main article: Precipitation types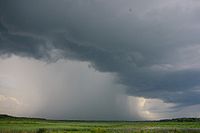 A thunderstorm with heavy precipitation
Precipitation is a major component of the water cycle, and is responsible for depositing most of the fresh water on the planet. Approximately 505,000 km3 (121,000 cu mi) of water falls as precipitation each year, 398,000 km3 (95,000 cu mi) of it over the oceans.[3] Given the Earth's surface area, that means the globally averaged annual precipitation is 990 millimetres (39 in).
Mechanisms of producing precipitation include convective, stratiform,[7] and orographic rainfall.[8] Convective processes involve strong vertical motions that can cause the overturning of the atmosphere in that location within an hour and cause heavy precipitation,[9] while stratiform processes involve weaker upward motions and less intense precipitation. Precipitation can be divided into three categories, based on whether it falls as liquid water, liquid water that freezes on contact with the surface, or ice. Mixtures of different types of precipitation, including types in different categories, can fall simultaneously. Liquid forms of precipitation include rain and drizzle. Rain or drizzle that freezes on contact within a subfreezing air mass is called "freezing rain" or "freezing drizzle". Frozen forms of precipitation include snow, ice needles, ice pellets, hail, and graupel.[10]
How the air becomes saturated
Cooling air to its dew point
The dew point is the temperature to which a parcel must be cooled in order to become saturated, and (unless super-saturation occurs) condenses to water.[11] Water vapour normally begins to condense on condensation nuclei such as dust, ice, and salt in order to form clouds. An elevated portion of a frontal zone forces broad areas of lift, which form clouds decks such as altostratus or cirrostratus. Stratus is a stable cloud deck which tends to form when a cool, stable air mass is trapped underneath a warm air mass. It can also form due to the lifting of advection fog during breezy conditions.[12]
There are four main mechanisms for cooling the air to its dew point: adiabatic cooling, conductive cooling, radiational cooling, and evaporative cooling. Adiabatic cooling occurs when air rises and expands.[13] The air can rise due to convection, large-scale atmospheric motions, or a physical barrier such as a mountain (orographic lift). Conductive cooling occurs when the air comes into contact with a colder surface,[14] usually by being blown from one surface to another, for example from a liquid water surface to colder land. Radiational cooling occurs due to the emission of infrared radiation, either by the air or by the surface underneath.[15] Evaporative cooling occurs when moisture is added to the air through evaporation, which forces the air temperature to cool to its wet-bulb temperature, or until it reaches saturation.[16]
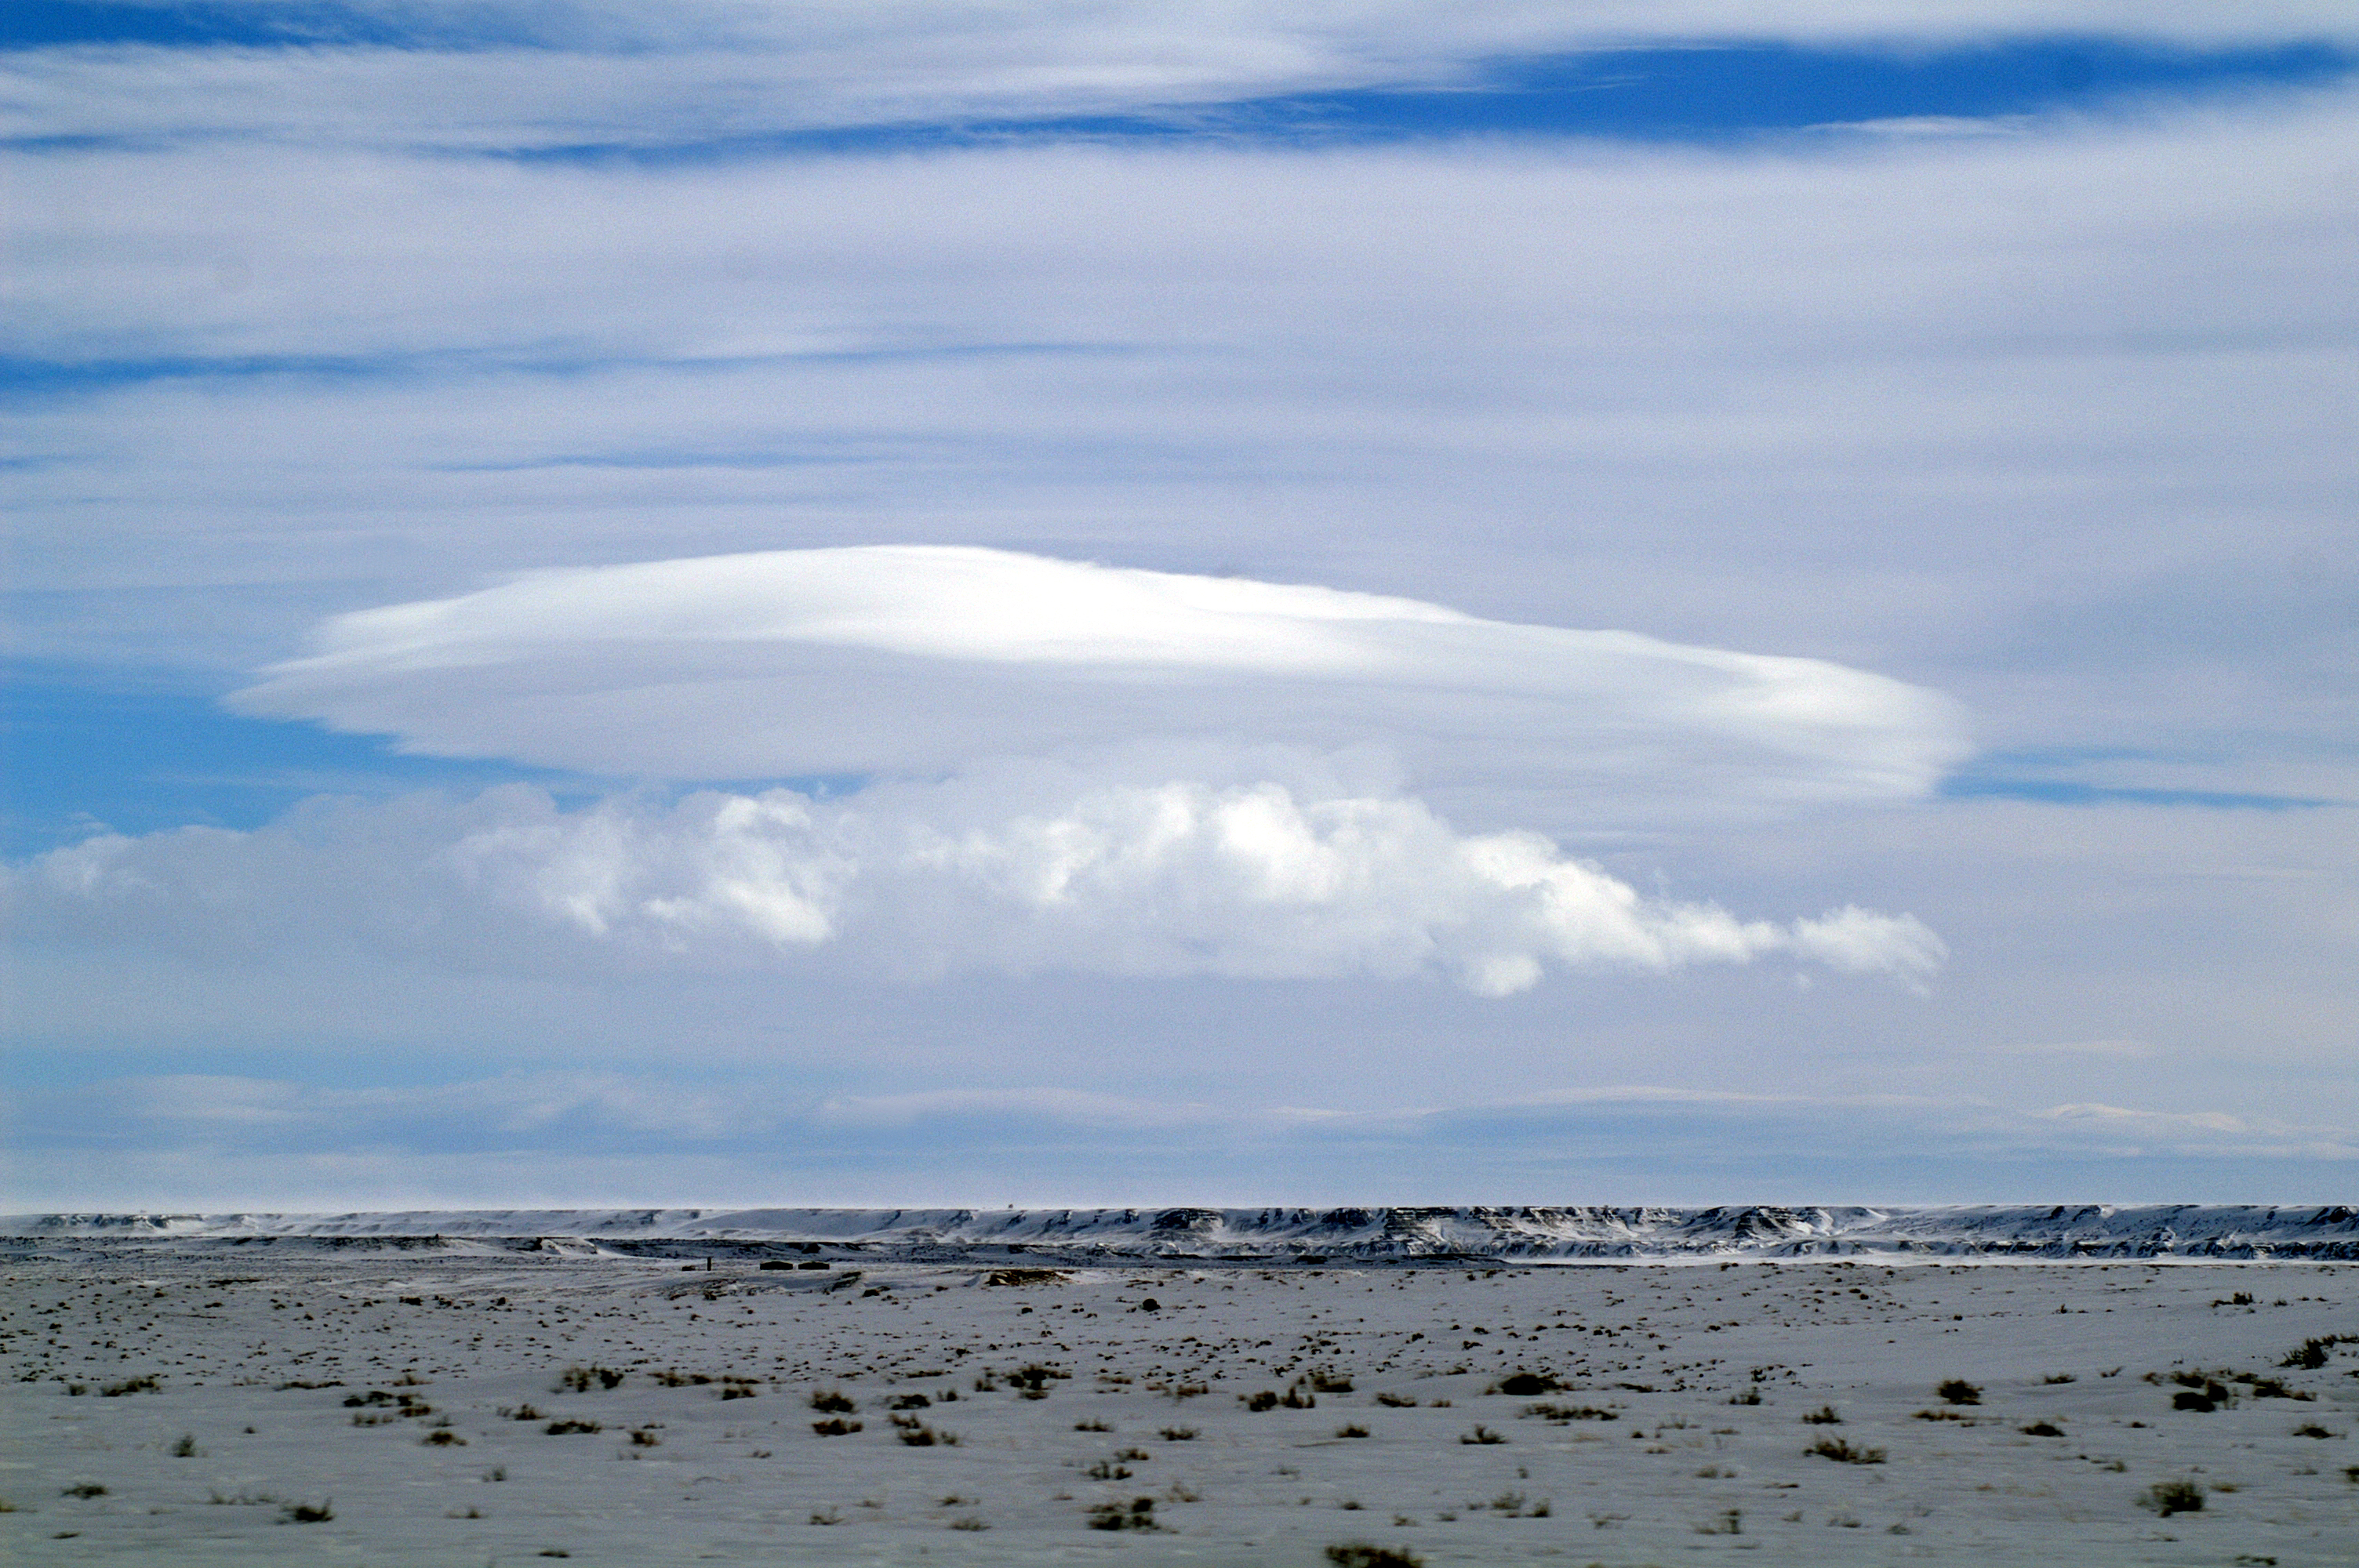
 Lenticular cloud forming due to mountains over Wyoming
Adding moisture to the air
The main ways water vapour is added to the air are: wind convergence into areas of upward motion,[9] precipitation or virga falling from above,[17] daytime heating evaporating water from the surface of oceans, water bodies or wet land,[18] transpiration from plants,[19] cool or dry air moving over warmer water,[20] and lifting air over mountains.[21]
Formation
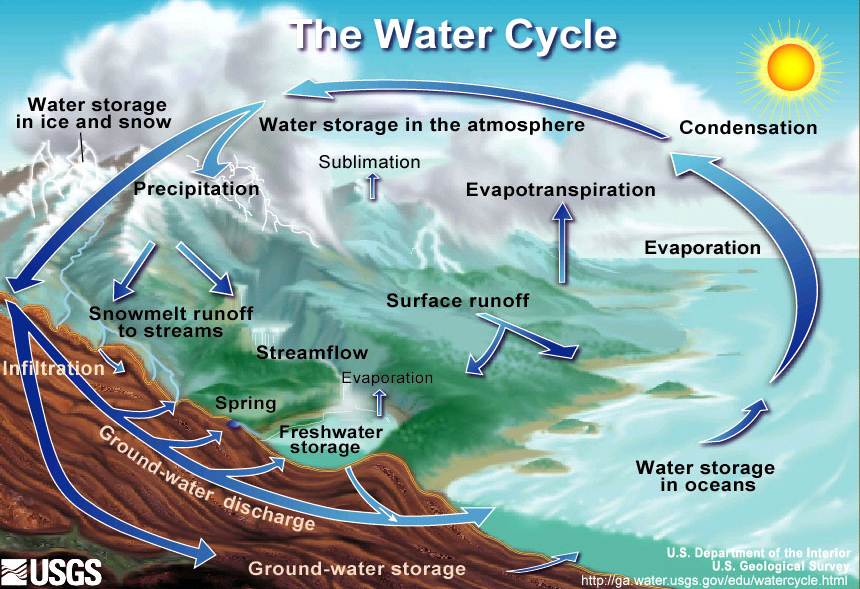
Main article: Water cycle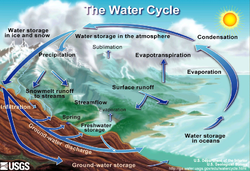 Condensation and coalescence are important parts of the water cycle.
Raindrops
Coalescence occurs when water droplets fuse to create larger water droplets, or when water droplets freeze onto an ice crystal, which is known as the Bergeron process. The fall rate of very small droplets is negligible, hence clouds do not fall out of the sky; precipitation will only occur when these coalesce into larger drops. When air turbulence occurs, water droplets collide, producing larger droplets. As these larger water droplets descend, coalescence continues, so that drops become heavy enough to overcome air resistance and fall as rain.[22]
Raindrops have sizes ranging from 0.1 millimetres (0.0039 in) to 9 millimetres (0.35 in) mean diameter, above which they tend to break up. Smaller drops are called cloud droplets, and their shape is spherical. As a raindrop increases in size, its shape becomes more oblate, with its largest cross-section facing the oncoming airflow. Contrary to the cartoon pictures of raindrops, their shape does not resemble a teardrop.[23] Intensity and duration of rainfall are usually inversely related, i.e., high intensity storms are likely to be of short duration and low intensity storms can have a long duration.[24][25] Rain drops associated with melting hail tend to be larger than other rain drops.[26] The METAR code for rain is RA, while the coding for rain showers is SHRA.[27]
Ice pellets
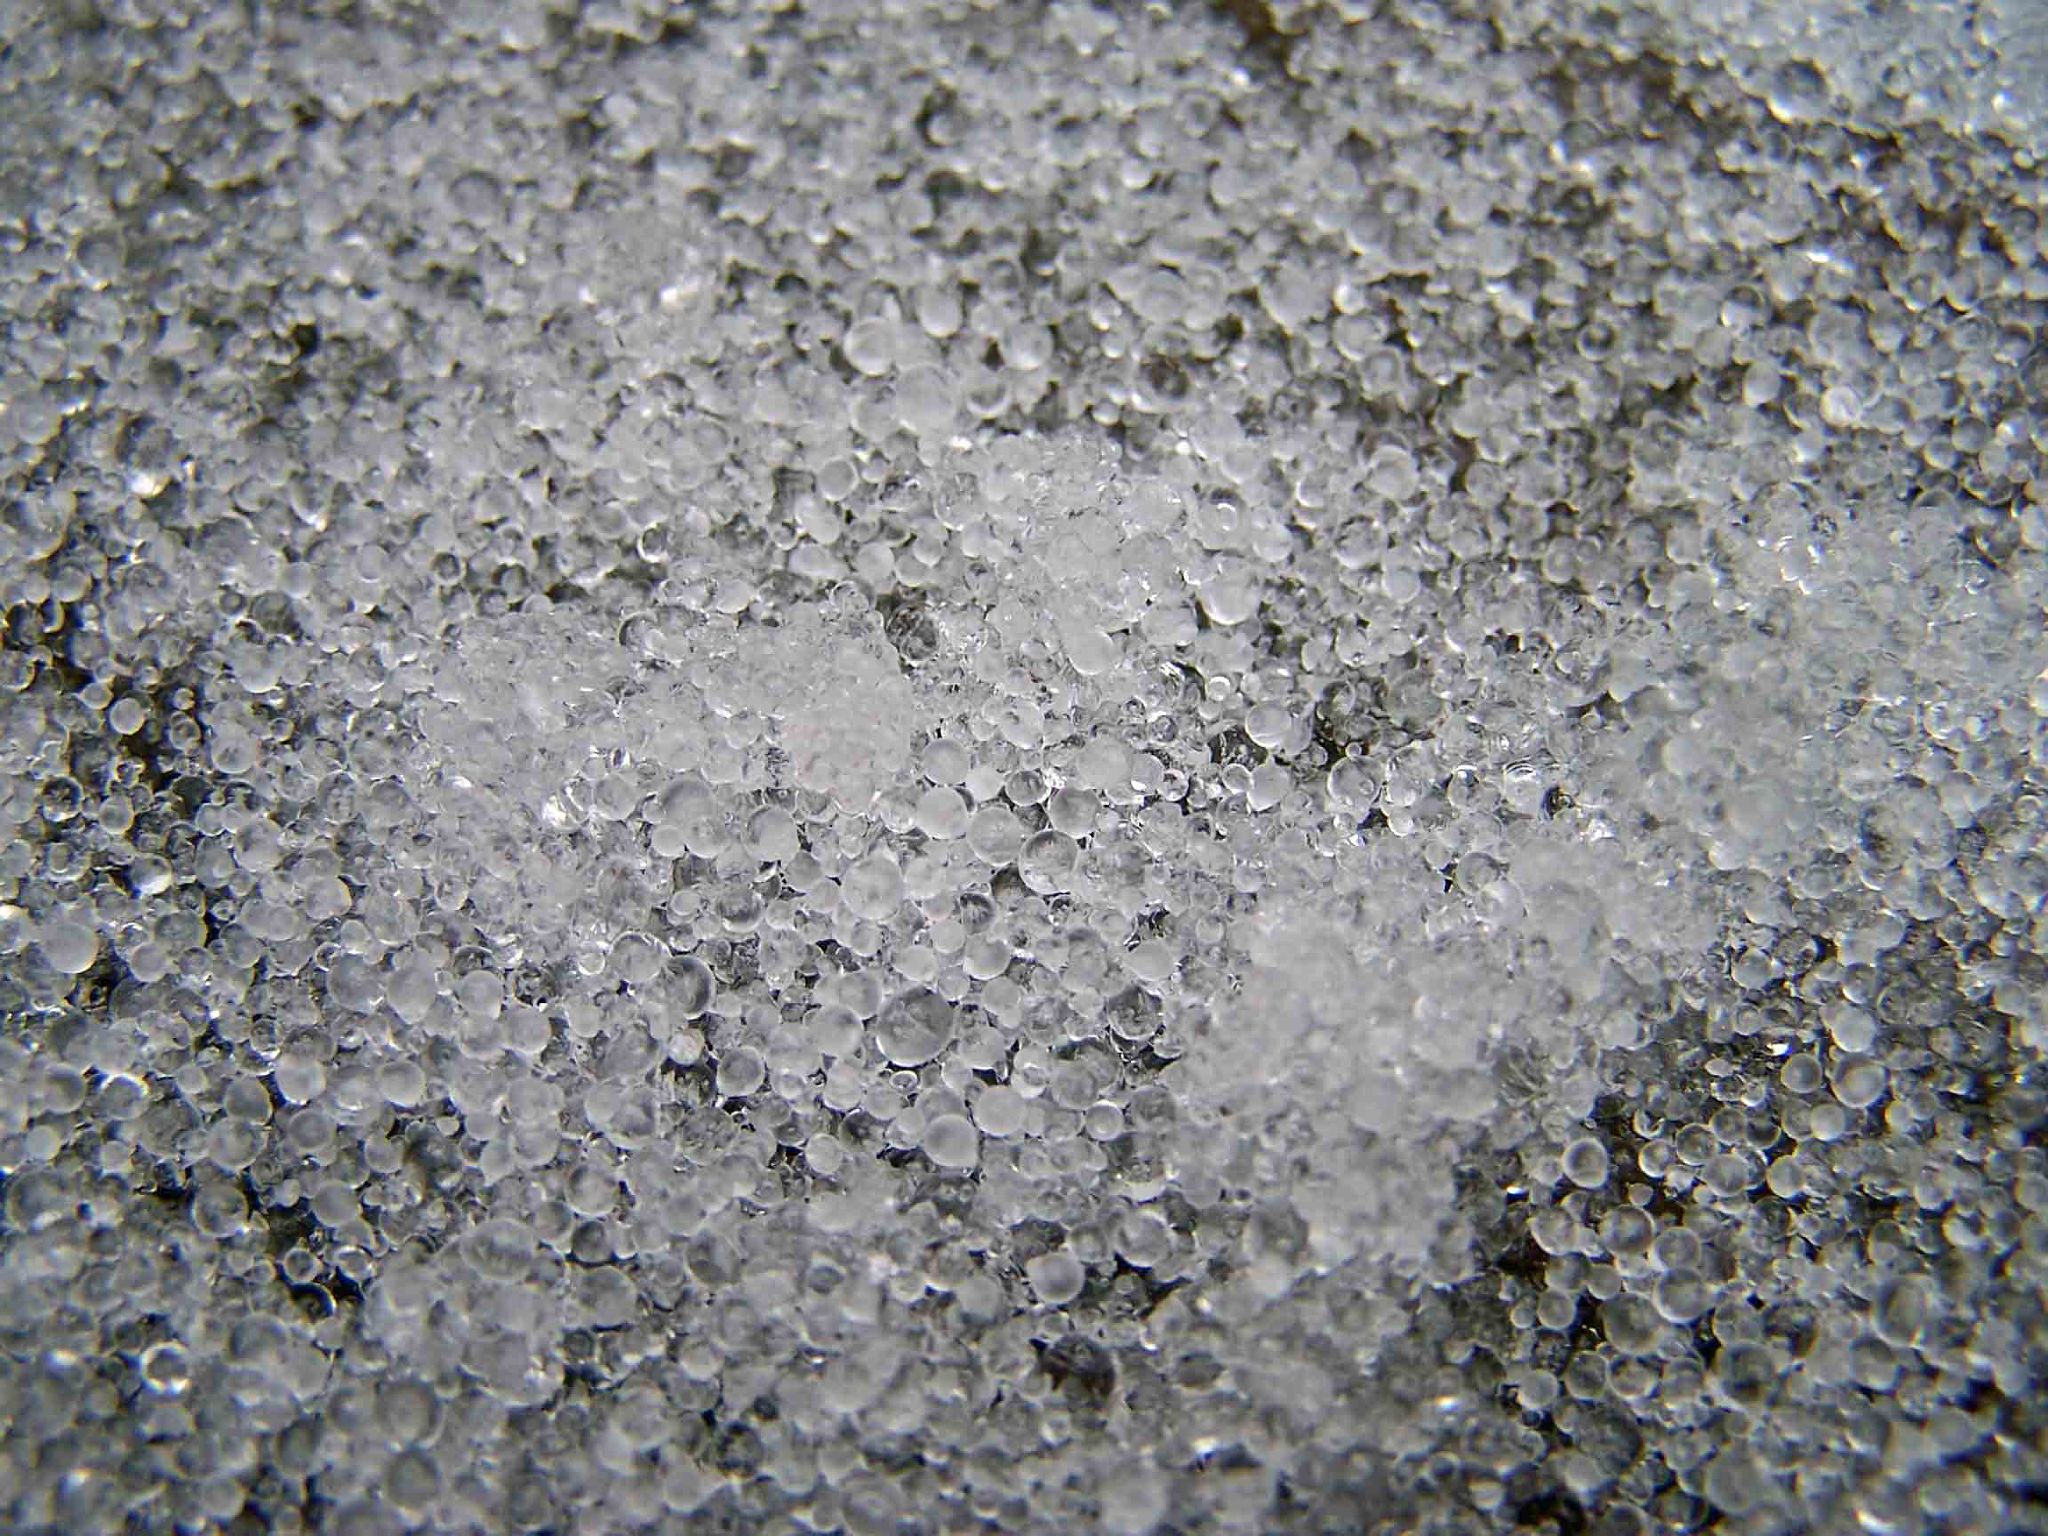
Main article: Ice pellets An accumulation of ice pellets
Ice pellets or sleet are a form of precipitation consisting of small, translucent balls of ice. Ice pellets are usually (but not always) smaller than hailstones.[28] They often bounce when they hit the ground, and generally do not freeze into a solid mass unless mixed with freezing rain. The METAR code for ice pellets is PL.[27]
Ice pellets form when a layer of above-freezing air exists with sub-freezing air both above and below it. This causes the partial or complete melting of any snowflakes falling through the warm layer. As they fall back into the sub-freezing layer closer to the surface, they re-freeze into ice pellets. However, if the sub-freezing layer beneath the warm layer is too small, the precipitation will not have time to re-freeze, and freezing rain will be the result at the surface. A temperature profile showing a warm layer above the ground is most likely to be found in advance of a warm front during the cold season,[29] but can occasionally be found behind a passing cold front.
Hail
Main article: Hail A large hailstone, about 6 cm (2.36 in) in diameter
Like other precipitation, hail forms in storm clouds when supercooled water droplets freeze on contact with condensation nuclei, such as dust or dirt. The storm's updraft blows the hailstones to the upper part of the cloud. The updraft dissipates and the hailstones fall down, back into the updraft, and are lifted up again. Hail has a diameter of 5 millimetres (0.20 in) or more.[30] Within METAR code, GR is used to indicate larger hail, of a diameter of at least 6.4 millimetres (0.25 in). GR is derived from the French word grêle. Smaller-sized hail, as well as snow pellets, use the coding of GS, which is short for the French word grésil.[27] Stones just larger than golf ball-sized are one of the most frequently reported hail sizes.[31] Hailstones can grow to 15 centimetres (6 in) and weigh more than .5 kilograms (1.1 lb).[32] In large hailstones, latent heat released by further freezing may melt the outer shell of the hailstone. The hailstone then may undergo 'wet growth', where the liquid outer shell collects other smaller hailstones.[33] The hailstone gains an ice layer and grows increasingly larger with each ascent. Once a hailstone becomes too heavy to be supported by the storm's updraft, it falls from the cloud.[34]
Snowflakes
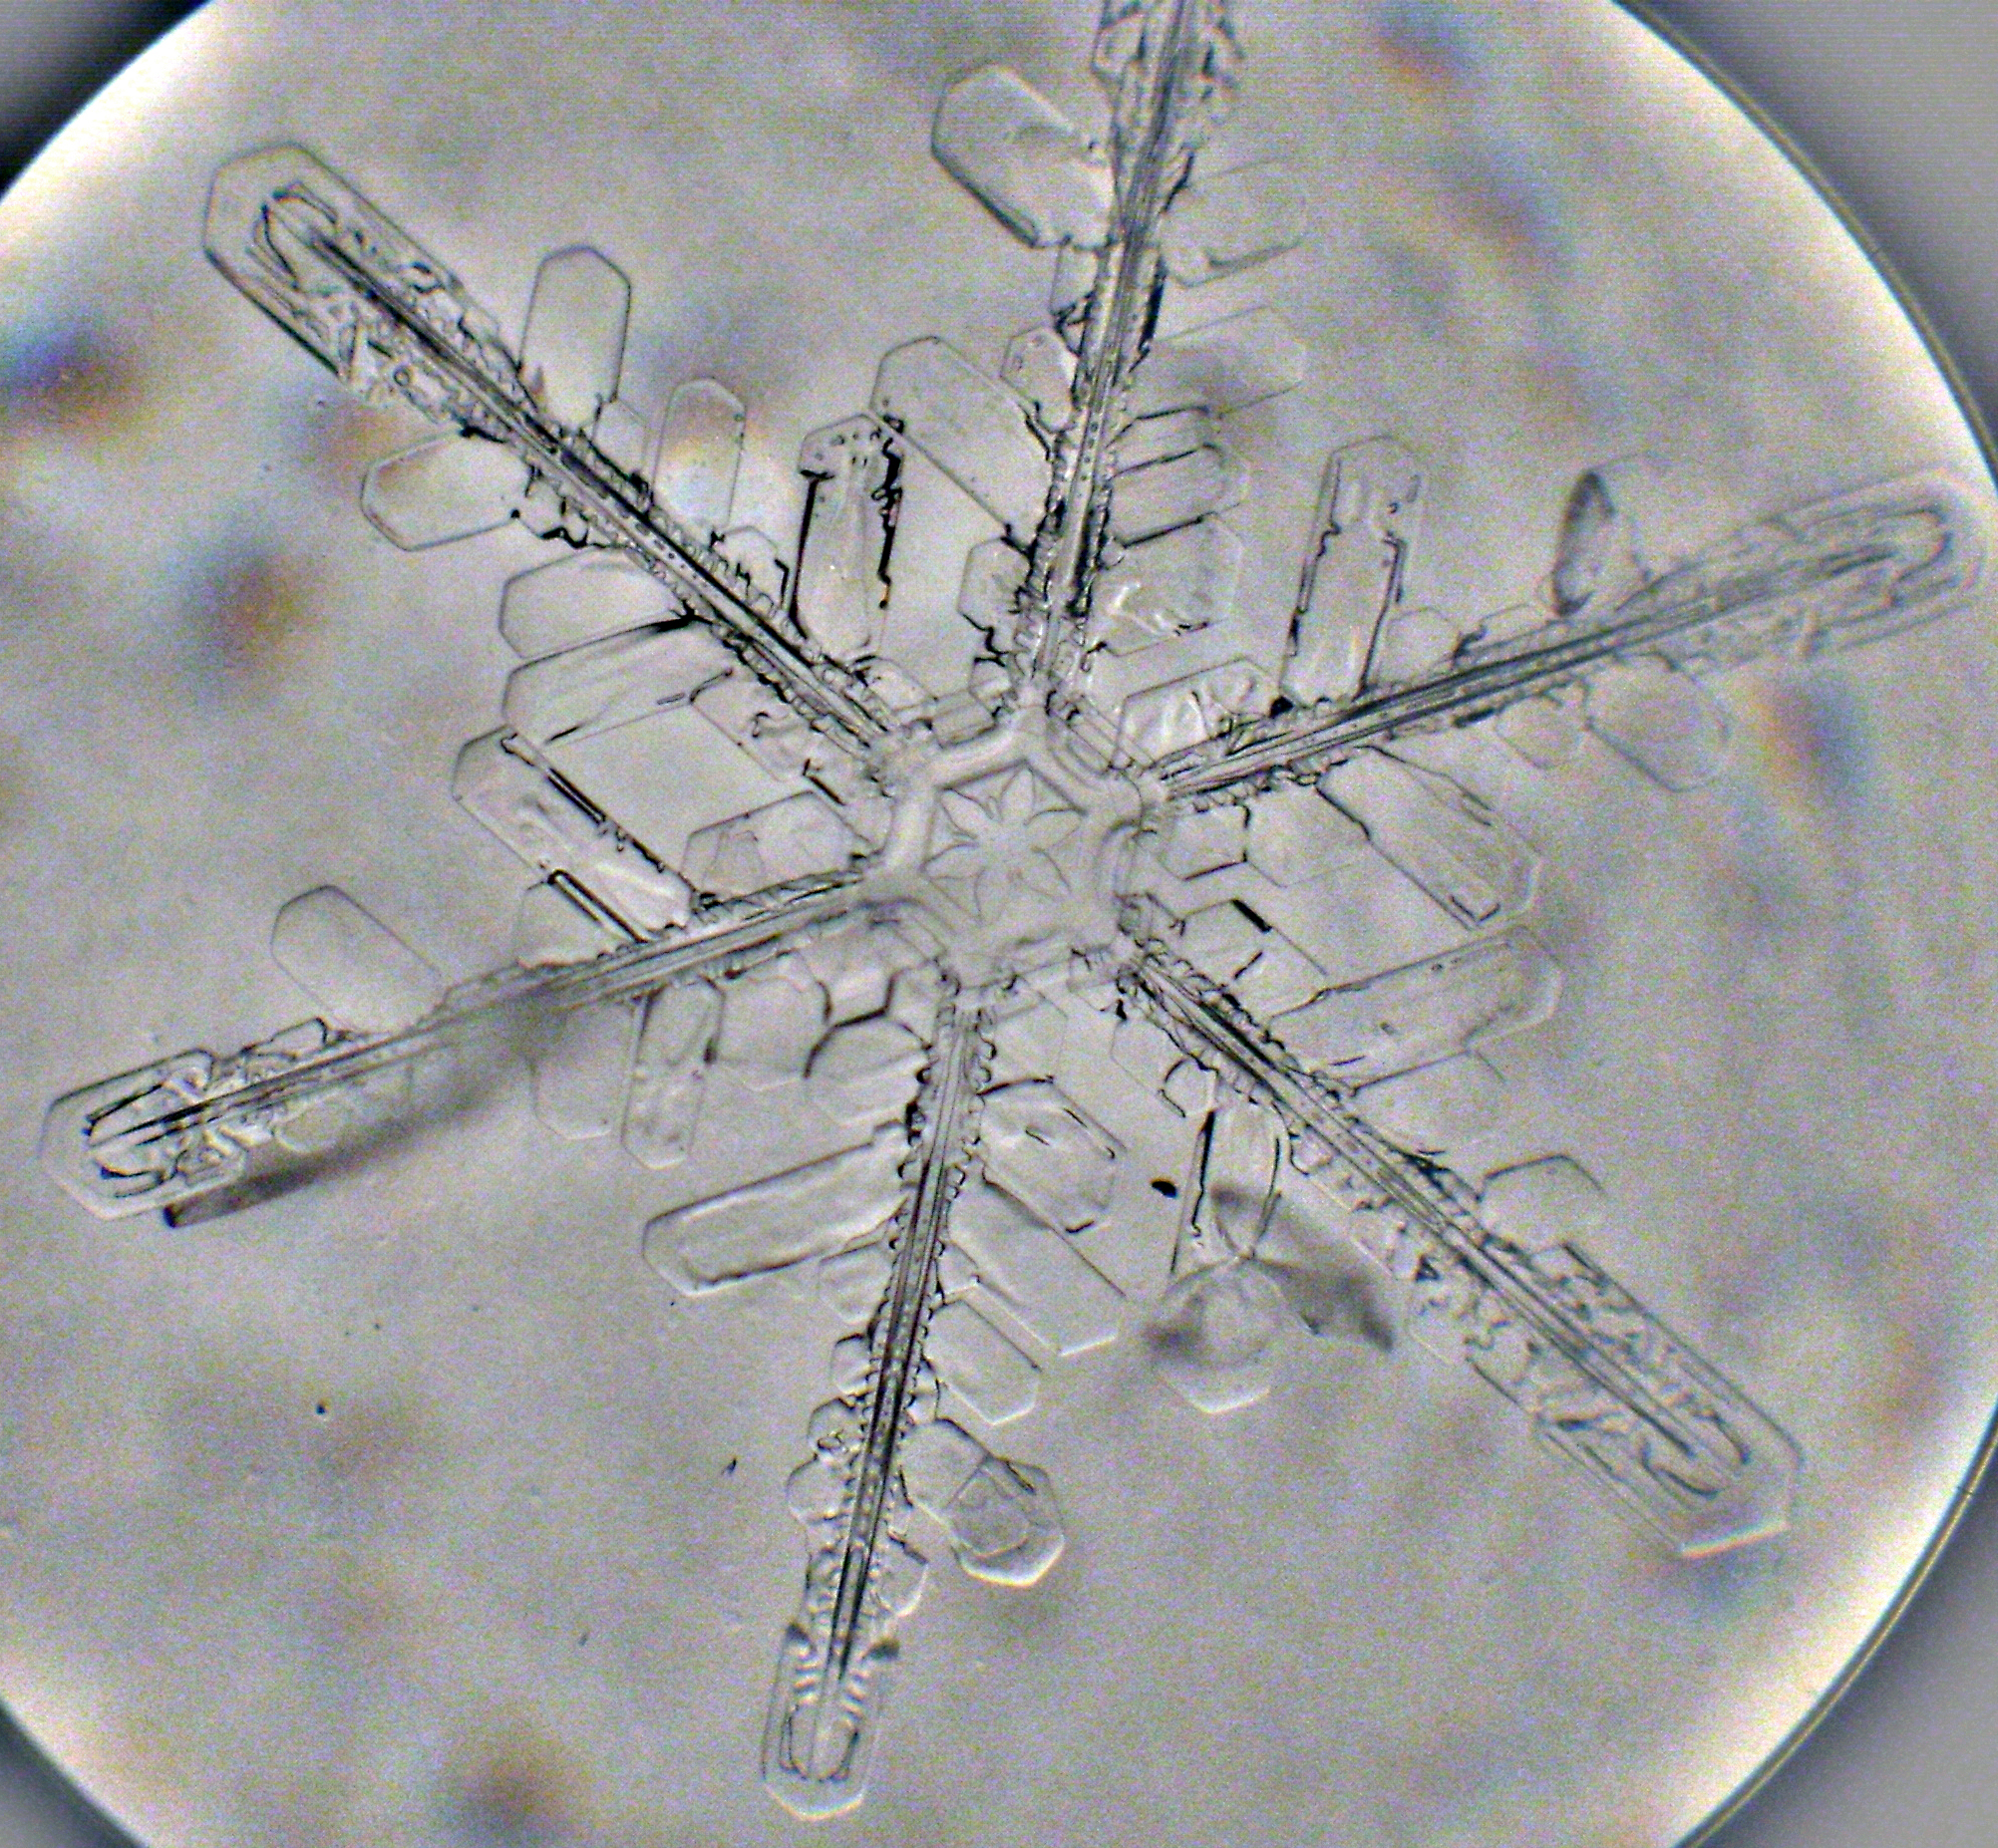
Main article: Snowflake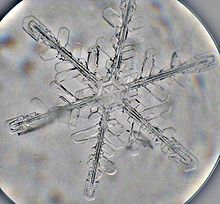 Snowflake viewed in an optical microscope
Snow crystals form when tiny supercooled cloud droplets (about 10 μm in diameter) freeze. Once a droplet has frozen, it grows in the supersaturated environment. Because water droplets are more numerous than the ice crystals the crystals are able to grow to hundreds of micrometers or millimeters in size at the expense of the water droplets. This process is known as the Wegner-Bergeron-Findeison process. The corresponding depletion of water vapor causes the droplets to evaporate, meaning that the ice crystals grow at the droplets' expense. These large crystals are an efficient source of precipitation, since they fall through the atmosphere due to their mass, and may collide and stick together in clusters, or aggregates. These aggregates are snowflakes, and are usually the type of ice particle that falls to the ground.[35] Guinness World Records list the world's largest snowflakes as those of January 1887 at Fort Keogh, Montana; allegedly one measured 38 cm (15 inches) wide.[36] The exact details of the sticking mechanism remain a subject of research.
Although the ice is clear, scattering of light by the crystal facets and hollows/imperfections mean that the crystals often appear white in color due to diffuse reflection of the whole spectrum of light by the small ice particles.[37] The shape of the snowflake is determined broadly by the temperature and humidity at which it is formed.[35] Rarely, at a temperature of around −2 °C (28 °F), snowflakes can form in threefold symmetry—triangular snowflakes.[38] The most common snow particles are visibly irregular, although near-perfect snowflakes may be more common in pictures because they are more visually appealing. No two snowflakes are alike,[39] which grow at different rates and in different patterns depending on the changing temperature and humidity within the atmosphere that the snowflake falls through on its way to the ground.[40] The METAR code for snow is SN, while snow showers are coded SHSN.[27]
Diamond dust
Main article: Diamond dustDiamond dust, also known as ice needles or ice crystals, forms at temperatures approaching −40 °F (−40 °C) due to air with slightly higher moisture from aloft mixing with colder, surface based air.[41] They are made of simple ice crystals that are hexagonal in shape.[42] The METAR identifier for diamond dust within international hourly weather reports is IC.[27]
Causes
Frontal activity
Main article: Weather frontsStratiform or dynamic precipitation occurs as a consequence of slow ascent of air in synoptic systems (on the order of cm/s), such as over surface cold fronts, and over and ahead of warm fronts. Similar ascent is seen around tropical cyclones outside of the eyewall, and in comma-head precipitation patterns around mid-latitude cyclones.[43] A wide variety of weather can be found along an occluded front, with thunderstorms possible, but usually their passage is associated with a drying of the air mass. Occluded fronts usually form around mature low-pressure areas.[44] Precipitation may occur on celestial bodies other than Earth. When it gets cold, Mars has precipitation that most likely takes the form of ice needles, rather than rain or snow.[4]
Convection
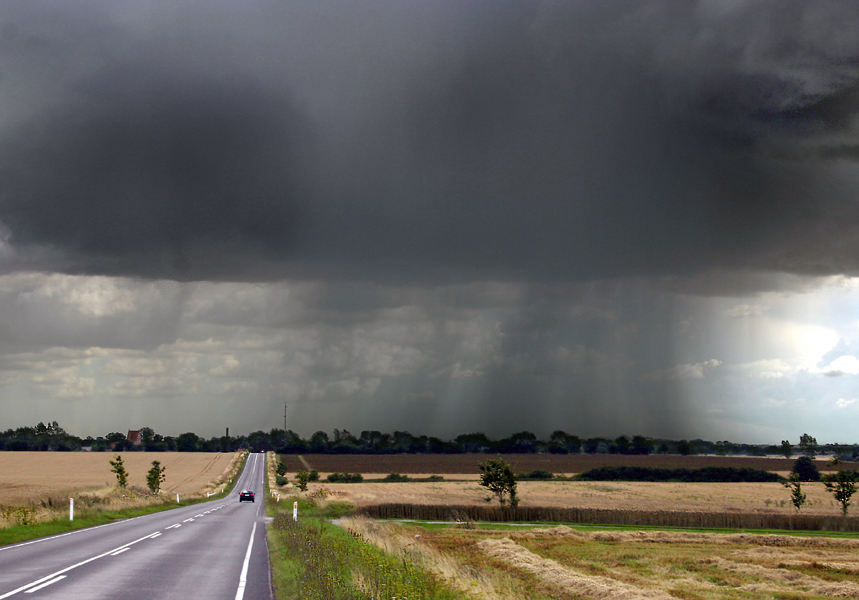
 Convective precipitation
Convective rain, or showery precipitation, occurs from convective clouds, e.g., cumulonimbus or cumulus congestus. It falls as showers with rapidly changing intensity. Convective precipitation falls over a certain area for a relatively short time, as convective clouds have limited horizontal extent. Most precipitation in the tropics appears to be convective; however, it has been suggested that stratiform precipitation also occurs.[25][43] Graupel and hail indicate convection.[45] In mid-latitudes, convective precipitation is intermittent and often associated with baroclinic boundaries such as cold fronts, squall lines, and warm fronts.[46]
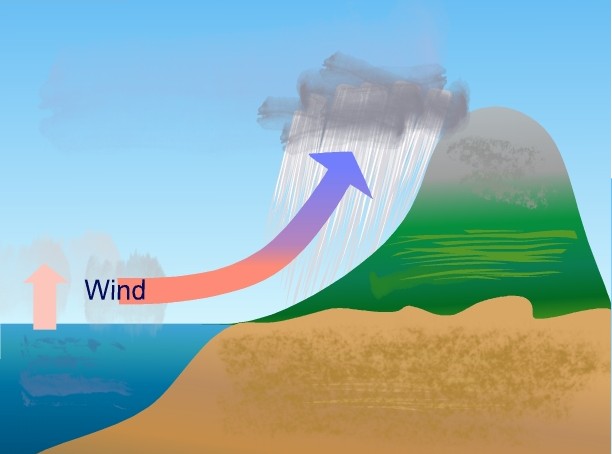
Orographic effects
See also: Orographic lift and Precipitation types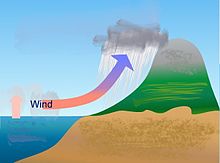 Orographic precipitation
Orographic precipitation occurs on the windward side of mountains and is caused by the rising air motion of a large-scale flow of moist air across the mountain ridge, resulting in adiabatic cooling and condensation. In mountainous parts of the world subjected to relatively consistent winds (for example, the trade winds), a more moist climate usually prevails on the windward side of a mountain than on the leeward or downwind side. Moisture is removed by orographic lift, leaving drier air (see katabatic wind) on the descending and generally warming, leeward side where a rain shadow is observed.[21]
In Hawaii, Mount Waiʻaleʻale, on the island of Kauai, is notable for its extreme rainfall, as it has the second highest average annual rainfall on Earth, with 460 inches (12,000 mm).[47] Storm systems affect the state with heavy rains between October and March. Local climates vary considerably on each island due to their topography, divisible into windward (Koʻolau) and leeward (Kona) regions based upon location relative to the higher mountains. Windward sides face the east to northeast trade winds and receive much more rainfall; leeward sides are drier and sunnier, with less rain and less cloud cover.[48]
In South America, the Andes mountain range blocks Pacific moisture that arrives in that continent, resulting in a desertlike climate just downwind across western Argentina.[49] The Sierra Nevada range creates the same effect in North America forming the Great Basin and Mojave Deserts.[50][51]
Snow
Main article: Snow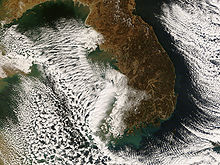 Lake-effect snow bands near the Korean Peninsula
Extratropical cyclones can bring cold and dangerous conditions with heavy rain and snow with winds exceeding 119 km/h (74 mph),[52] (sometimes referred to as windstorms in Europe). The band of precipitation that is associated with their warm front is often extensive, forced by weak upward vertical motion of air over the frontal boundary which condenses as it cools and produces precipitation within an elongated band,[53] which is wide and stratiform, meaning falling out of nimbostratus clouds.[54] When moist air tries to dislodge an arctic air mass, overrunning snow can result within the poleward side of the elongated precipitation band. In the Northern Hemisphere, poleward is towards the North Pole, or north. Within the Southern Hemisphere, poleward is towards the South Pole, or south.
Southwest of extratropical cyclones, curved cyclonic flow bringing cold air across the relatively warm water bodies can lead to narrow lake-effect snow bands. Those bands bring strong localized snowfall which can be understood as follows: Large water bodies such as lakes efficiently store heat that results in significant temperature differences (larger than 13 °C or 23 °F) between the water surface and the air above.[55] Because of this temperature difference, warmth and moisture are transported upward, condensing into vertically oriented clouds (see satellite picture) which produce snow showers. The temperature decrease with height and cloud depth are directly affected by both the water temperature and the large-scale environment. The stronger the temperature decrease with height, the deeper the clouds get, and the greater the precipitation rate becomes.[56]
In mountainous areas, heavy snowfall accumulates when air is forced to ascend the mountains and squeeze out precipitation along their windward slopes, which in cold conditions, falls in the form of snow. Because of the ruggedness of terrain, forecasting the location of heavy snowfall remains a significant challenge.[57]
Within the tropics
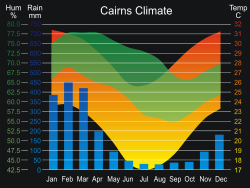 Rainfall distribution by month in Cairns showing the extent of the wet season at that locationSee also: Monsoon and Tropical cycloneMain article: Wet season
The wet, or rainy, season is the time of year, covering one or more months, when most of the average annual rainfall in a region falls.[58] The term green season is also sometimes used as a euphemism by tourist authorities.[59] Areas with wet seasons are dispersed across portions of the tropics and subtropics.[60] Savanna climates and areas with monsoon regimes have wet summers and dry winters. Tropical rainforests technically do not have dry or wet seasons, since their rainfall is equally distributed through the year.[61] Some areas with pronounced rainy seasons will see a break in rainfall mid-season when the intertropical convergence zone or monsoon trough move poleward of their location during the middle of the warm season.[24] When the wet season occurs during the warm season, or summer, rain falls mainly during the late afternoon and early evening hours. The wet season is a time when air quality improves,[62] freshwater quality improves,[63][64] and vegetation grows significantly. Soil nutrients diminish and erosion increases.[24] Animals have adaptation and survival strategies for the wetter regime. The previous dry season leads to food shortages into the wet season, as the crops have yet to mature. Developing countries have noted that their populations show seasonal weight fluctuations due to food shortages seen before the first harvest, which occurs late in the wet season.[65]
Tropical cyclones, a source of very heavy rainfall, consist of large air masses several hundred miles across with low pressure at the centre and with winds blowing inward towards the centre in either a clockwise direction (southern hemisphere) or counterclockwise (northern hemisphere).[66] Although cyclones can take an enormous toll in lives and personal property, they may be important factors in the precipitation regimes of places they impact, as they may bring much-needed precipitation to otherwise dry regions.[67] Areas in their path can receive a year's worth of rainfall from a tropical cyclone passage.[68]
Large-scale geographical distribution
See also: Earth rainfall climatologyOn the large scale, the highest precipitation amounts outside topography fall in the tropics, closely tied to the Intertropical Convergence Zone, itself the ascending branch of the Hadley cell. Mountainous locales near the equator in Colombia are amongst the wettest places on Earth.[69] North and south of this are regions of descending air that form subtropical ridges where precipitation is low;[70] the land surface underneath is usually arid, which forms most of the Earth's deserts.[71] An exception to this rule is in Hawaii, where upslope flow due to the trade winds lead to one of the wettest locations on Earth.[72] Otherwise, the flow of the Westerlies into the Rocky Mountains lead to the wettest, and at elevation snowiest,[73] locations within North America. In Asia during the wet season, the flow of moist air into the Himalayas leads to some of the greatest rainfall amounts measured on Earth in northeast India.
Measurement
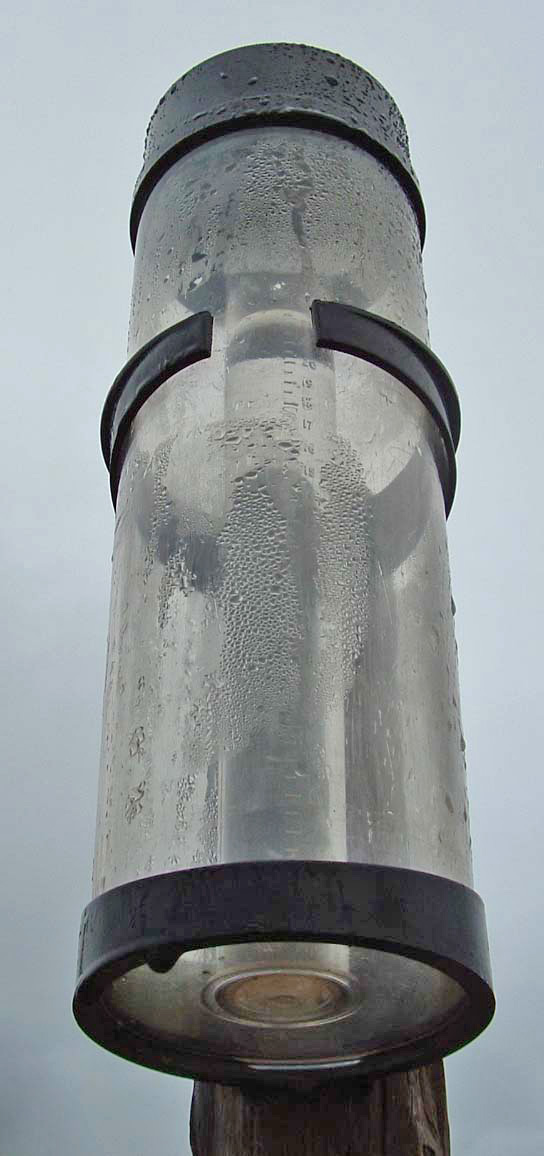
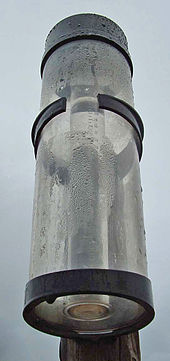 Standard rain gauge
The standard way of measuring rainfall or snowfall is the standard rain gauge, which can be found in 100 mm (4 in) plastic and 200 mm (8 in) metal varieties.[74] The inner cylinder is filled by 25 mm (1 in) of rain, with overflow flowing into the outer cylinder. Plastic gauges have markings on the inner cylinder down to 0.25 mm (0.01 in) resolution, while metal gauges require use of a stick designed with the appropriate 0.25 mm (0.01 in) markings. After the inner cylinder is filled, the amount inside it is discarded, then filled with the remaining rainfall in the outer cylinder until all the fluid in the outer cylinder is gone, adding to the overall total until the outer cylinder is empty. These gauges are used in the winter by removing the funnel and inner cylinder and allowing snow and freezing rain to collect inside the outer cylinder. Some add anti-freeze to their gauge so they do not have to melt the snow or ice that falls into the gauge.[75] Once the snowfall/ice is finished accumulating, or as 300 mm (12 in) is approached, one can either bring it inside to melt, or use lukewarm water to fill the inner cylinder with in order to melt the frozen precipitation in the outer cylinder, keeping track of the warm fluid added, which is subsequently subtracted from the overall total once all the ice/snow is melted.[76]
Other types of gauges include the popular wedge gauge (the cheapest rain gauge and most fragile), the tipping bucket rain gauge, and the weighing rain gauge.[77] The wedge and tipping bucket gauges will have problems with snow. Attempts to compensate for snow/ice by warming the tipping bucket meet with limited success, since snow may sublimate if the gauge is kept much above freezing. Weighing gauges with antifreeze should do fine with snow, but again, the funnel needs to be removed before the event begins. For those looking to measure rainfall the most inexpensively, a can that is cylindrical with straight sides will act as a rain gauge if left out in the open, but its accuracy will depend on what ruler is used to measure the rain with. Any of the above rain gauges can be made at home, with enough know-how.[78]
When a precipitation measurement is made, various networks exist across the United States and elsewhere where rainfall measurements can be submitted through the Internet, such as CoCoRAHS or GLOBE.[79][80] If a network is not available in the area where one lives, the nearest local weather office will likely be interested in the measurement.[81]
Return period
See also: 100-year floodThe likelihood or probability of an event with a specified intensity and duration, is called the return period or frequency.[82] The intensity of a storm can be predicted for any return period and storm duration, from charts based on historic data for the location.[83] The term 1 in 10 year storm describes a rainfall event which is rare and is only likely to occur once every 10 years, so it has a 10 percent likelihood any given year. The rainfall will be greater and the flooding will be worse than the worst storm expected in any single year. The term 1 in 100 year storm describes a rainfall event which is extremely rare and which will occur with a likelihood of only once in a century, so has a 1 percent likelihood in any given year. The rainfall will be extreme and flooding to be worse than a 1 in 10 year event. As with all probability events, it is possible to have multiple "1 in 100 Year Storms" in a single year.[84]
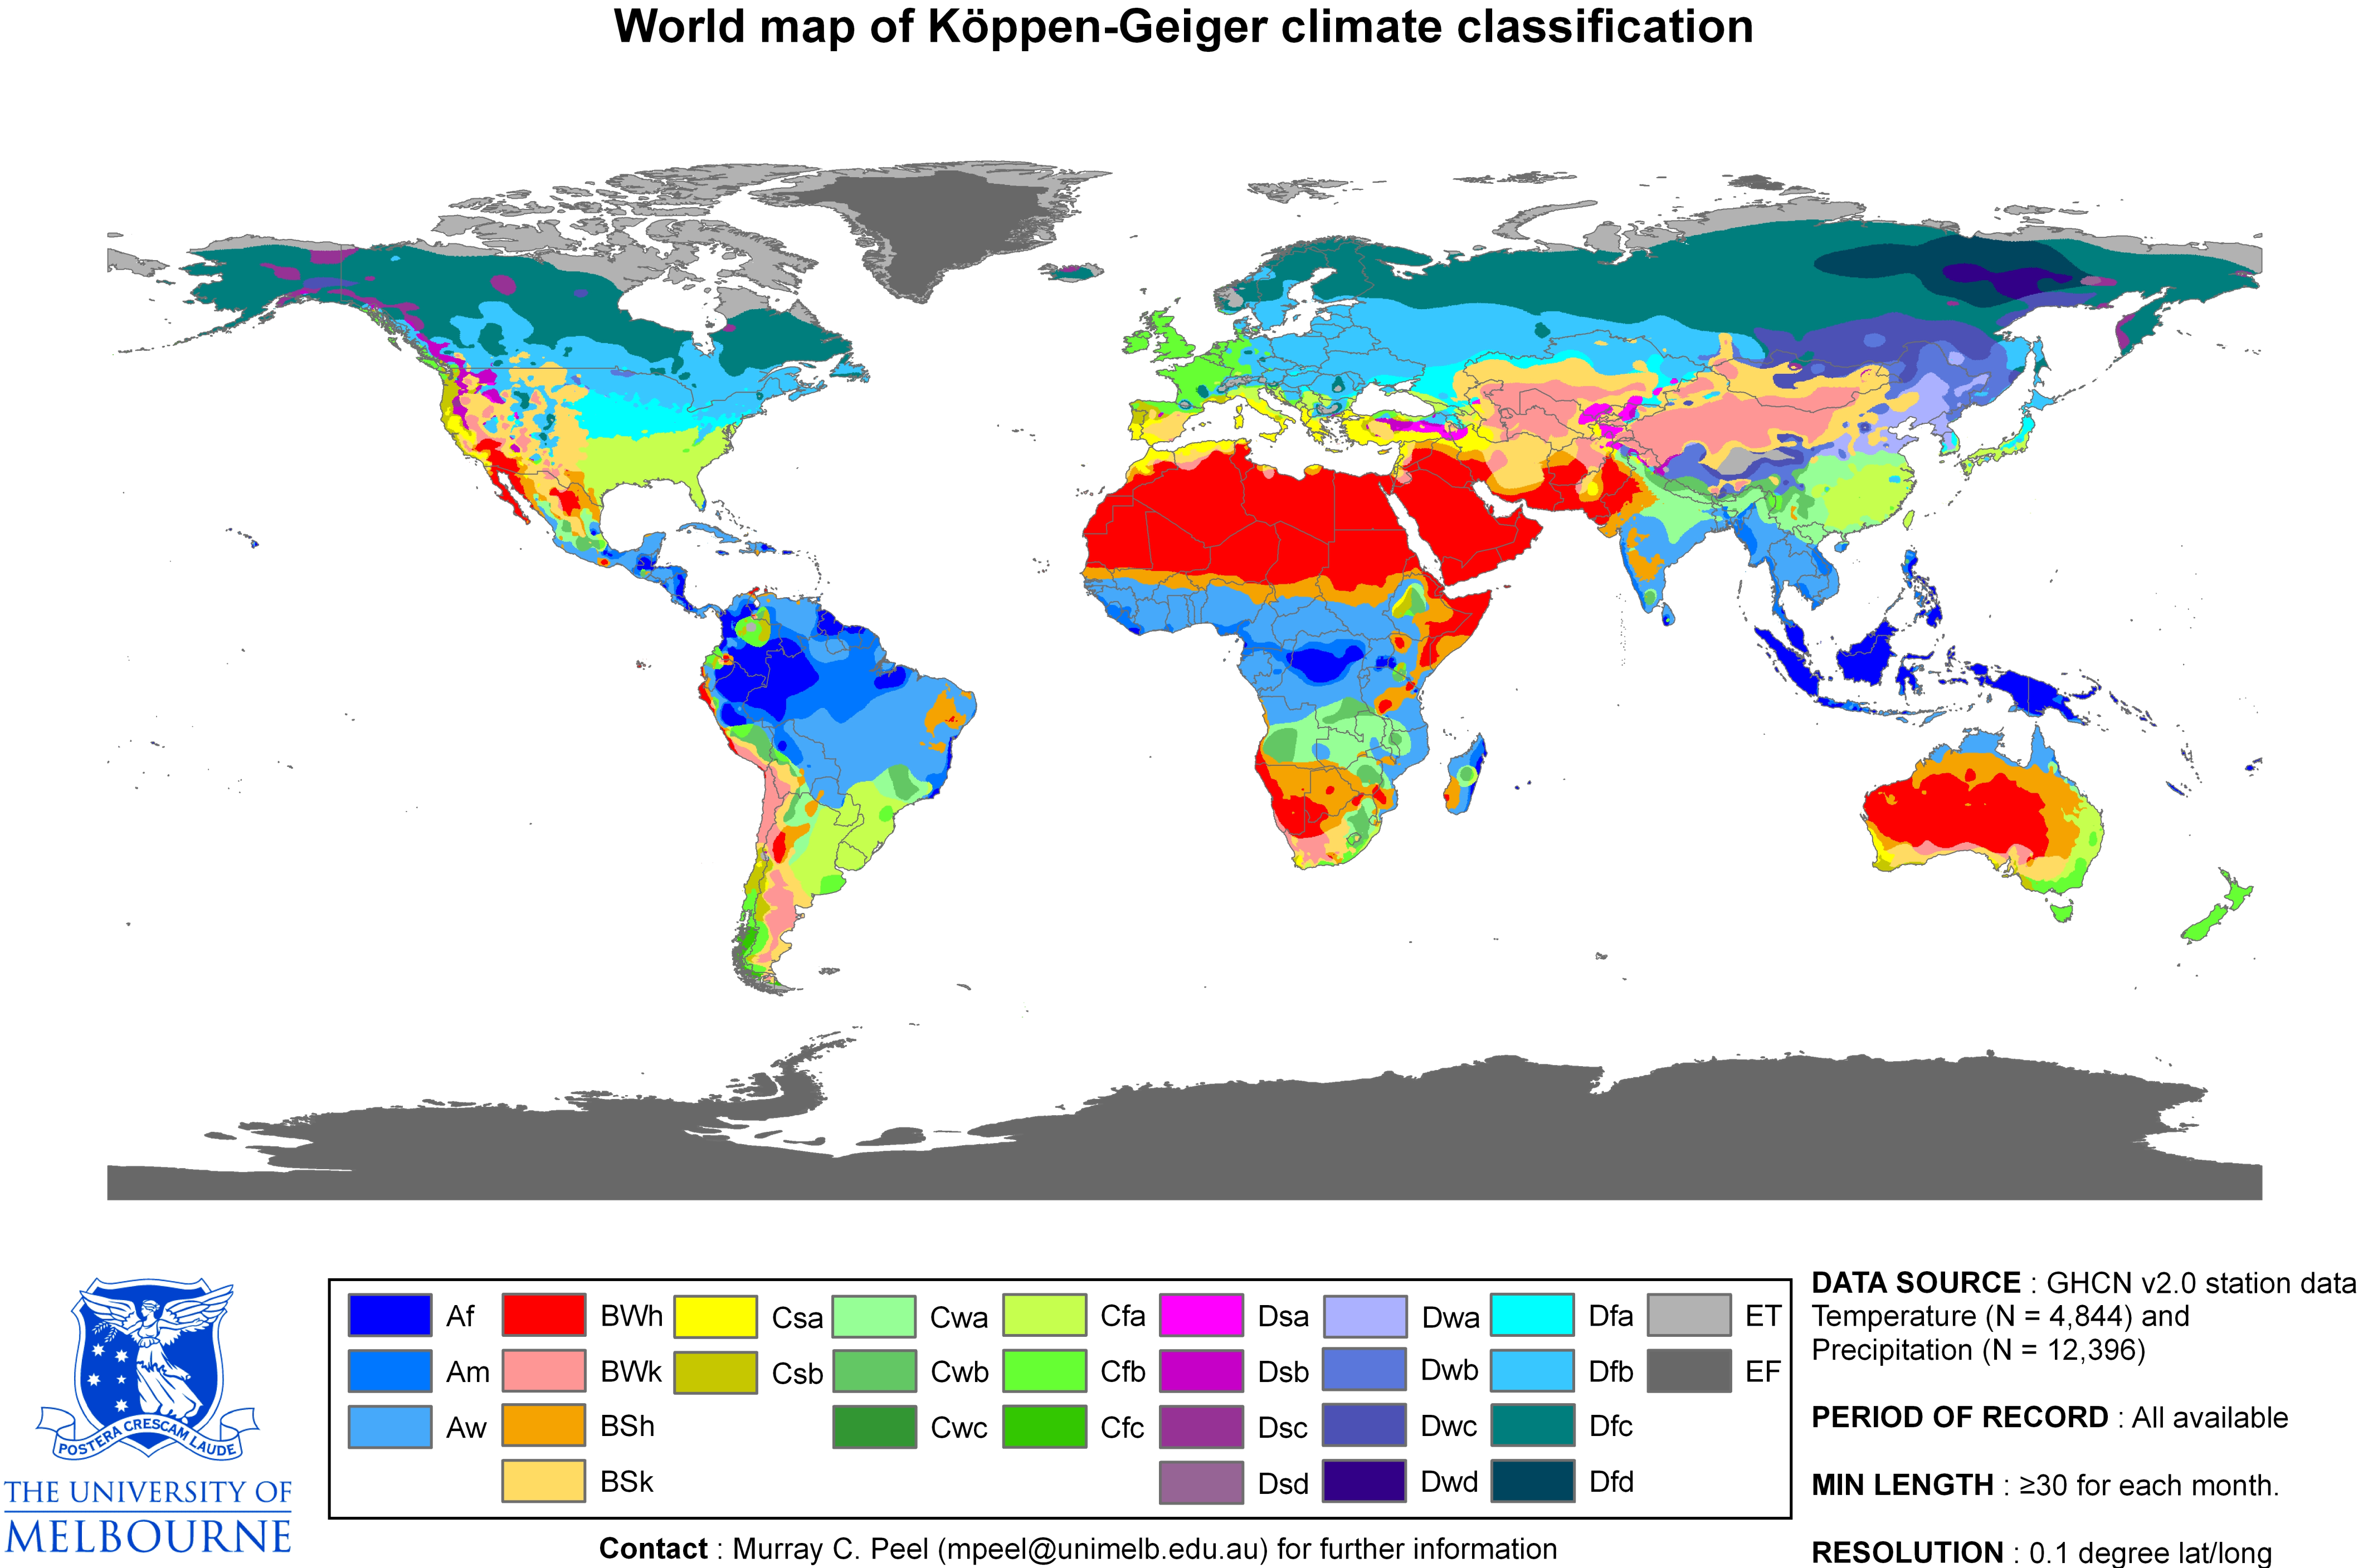
Role in Köppen climate classification
Main article: Köppen climate classificationThe Köppen classification depends on average monthly values of temperature and precipitation. The most commonly used form of the Köppen classification has five primary types labeled A through E. Specifically, the primary types are A, tropical; B, dry; C, mild mid-latitude; D, cold mid-latitude; and E, polar. The five primary classifications can be further divided into secondary classifications such as rain forest, monsoon, tropical savanna, humid subtropical, humid continental, oceanic climate, Mediterranean climate, steppe, subarctic climate, tundra, polar ice cap, and desert.
Rain forests are characterized by high rainfall, with definitions setting minimum normal annual rainfall between 1,750 millimetres (69 in) and 2,000 millimetres (79 in).[86] A tropical savanna is a grassland biome located in semi-arid to semi-humid climate regions of subtropical and tropical latitudes, with rainfall between 750 millimetres (30 in) and 1,270 millimetres (50 in) a year. They are widespread on Africa, and are also found in India, the northern parts of South America, Malaysia, and Australia.[87] The humid subtropical climate zone where winter rainfall (and sometimes snowfall) is associated with large storms that the westerlies steer from west to east. Most summer rainfall occurs during thunderstorms and from occasional tropical cyclones.[88] Humid subtropical climates lie on the east side continents, roughly between latitudes 20° and 40° degrees away from the equator.[89]
An oceanic (or maritime) climate is typically found along the west coasts at the middle latitudes of all the world's continents, bordering cool oceans, as well as southeastern Australia, and is accompanied by plentiful precipitation year round.[90] The Mediterranean climate regime resembles the climate of the lands in the Mediterranean Basin, parts of western North America, parts of Western and South Australia, in southwestern South Africa and in parts of central Chile. The climate is characterized by hot, dry summers and cool, wet winters.[91] A steppe is a dry grassland.[92] Subarctic climates are cold with continuous permafrost and little precipitation.[93]
Effect on agriculture
 Rainfall estimates for southern Japan and the surrounding region from July 20 to 27, 2009.
Precipitation, especially rain, has a dramatic effect on agriculture. All plants need at least some water to survive, therefore rain (being the most effective means of watering) is important to agriculture. While a regular rain pattern is usually vital to healthy plants, too much or too little rainfall can be harmful, even devastating to crops. Drought can kill crops and increase erosion,[94] while overly wet weather can cause harmful fungus growth.[95] Plants need varying amounts of rainfall to survive. For example, certain cacti require small amounts of water,[96] while tropical plants may need up to hundreds of inches of rain per year to survive.
In areas with wet and dry seasons, soil nutrients diminish and erosion increases during the wet season.[24] Animals have adaptation and survival strategies for the wetter regime. The previous dry season leads to food shortages into the wet season, as the crops have yet to mature.[97] Developing countries have noted that their populations show seasonal weight fluctuations due to food shortages seen before the first harvest, which occurs late in the wet season.[65]
Changes due to global warming
See also: Global warmingIncreasing temperatures tend to increase evaporation which leads to more precipitation. Precipitation has generally increased over land north of 30°N from 1900 through 2005 but has declined over the tropics since the 1970s. Globally there has been no statistically significant overall trend in precipitation over the past century, although trends have varied widely by region and over time. Eastern portions of North and South America, northern Europe, and northern and central Asia have become wetter. The Sahel, the Mediterranean, southern Africa and parts of southern Asia have become drier. There has been an increase in the number of heavy precipitation events over many areas during the past century, as well as an increase since the 1970s in the prevalence of droughts—especially in the tropics and subtropics. Changes in precipitation and evaporation over the oceans are suggested by the decreased salinity of mid- and high-latitude waters (implying more precipitation), along with increased salinity in lower latitudes (implying less precipitation, more evaporation, or both). Over the contiguous United States, total annual precipitation increased at an average rate of 6.1 percent per century since 1900, with the greatest increases within the East North Central climate region (11.6 percent per century) and the South (11.1 percent). Hawaii was the only region to show a decrease (-9.25 percent).[98]
Changes due to urban heat island
 Image of Atlanta, Georgia, showing temperature distribution, with hot areas appearing whiteSee also: Urban heat island
The urban heat island warms cities 0.6 °C (1.1 °F) to 5.6 °C (10.1 °F) above surrounding suburbs and rural areas. This extra heat leads to greater upward motion, which can induce additional shower and thunderstorm activity. Rainfall rates downwind of cities are increased between 48% and 116%. Partly as a result of this warming, monthly rainfall is about 28% greater between 20 miles (32 km) to 40 miles (64 km) downwind of cities, compared with upwind.[99] Some cities induce a total precipitation increase of 51%.[100]
Forecasting
Main article: Quantitative precipitation forecast Example of a five day rainfall forecast from the Hydrometeorological Prediction Center
The Quantitative Precipitation Forecast (abbreviated QPF) is the expected amount of liquid precipitation accumulated over a specified time period over a specified area.[101] A QPF will be specified when a measurable precipitation type reaching a minimum threshold is forecast for any hour during a QPF valid period. Precipitation forecasts tend to be bound by synoptic hours such as 0000, 0600, 1200 and 1800 GMT. Terrain is considered in QPFs by use of topography or based upon climatological precipitation patterns from observations with fine detail.[102] Starting in the mid to late 1990s, QPFs were used within hydrologic forecast models to simulate impact to rivers throughout the United States.[103] Forecast models show significant sensitivity to humidity levels within the planetary boundary layer, or in the lowest levels of the atmosphere, which decreases with height.[104] QPF can be generated on a quantitative, forecasting amounts, or a qualitative, forecasting the probability of a specific amount, basis.[105] Radar imagery forecasting techniques show higher skill than model forecasts within six to seven hours of the time of the radar image. The forecasts can be verified through use of rain gauge measurements, weather radar estimates, or a combination of both. Various skill scores can be determined to measure the value of the rainfall forecast.[106]
See also
- List of meteorology topics
- Mango showers, pre-monsoon showers in the Indian states of Karnataka and Kerala that help in the ripening of mangoes.
- Sunshower, an unusual meteorological phenomenon in which rain falls while the sun is shining.
- Wintry showers, an informal meteorological term for various mixtures of rain, freezing rain, sleet and snow.
References
- ^ "Precipitation". Glossary of Meteorology. American Meteorological Society. 2009. http://amsglossary.allenpress.com/glossary/search?id=precipitation1. Retrieved 2009-01-02.
- ^ The Weather World 2010 Project (1999). "Precipitation: hail, rain, freezing rain, sleet and snow". University of Illinois. http://ww2010.atmos.uiuc.edu/(Gh)/guides/mtr/cld/prcp/home.rxml. Retrieved 2009-01-02.
- ^ a b Dr. Chowdhury's Guide to Planet Earth (2005). "The Water Cycle". WestEd. http://www.planetguide.net/book/chapter_2/water_cycle.html. Retrieved 2006-10-24.
- ^ a b Dr. Jim Lochner (1998). "Ask an Astrophysicist". NASA Goddard Space Flight Center. http://imagine.gsfc.nasa.gov/docs/ask_astro/answers/980403c.html. Retrieved 2009-01-16.
- ^ Glossary of Meteorology (2009). "Hydrometeor". American Meteorological Society. http://amsglossary.allenpress.com/glossary/search?p=1&query=hydrometeor&submit=Search. Retrieved 2009-07-16.
- ^ The American Meteor Society (2001-08-27). "Definition of terms by the IAU Commission 22, 1961". http://www.amsmeteors.org/define.html. Retrieved 2009-07-16.
- ^ Emmanouil N. Anagnostou (2004). "A convective/stratiform precipitation classification algorithm for volume scanning weather radar observations". Meteorological Applications (Cambridge University Press) 11 (4): 291–300. Bibcode 2004MeApp..11..291A. doi:10.1017/S1350482704001409. http://journals.cambridge.org/action/displayAbstract?fromPage=online&aid=277148.
- ^ A.J. Dore, M. Mousavi-Baygi, R.I. Smith, J. Hall, D. Fowler and T.W. Choularton (June 2006). "A model of annual orographic precipitation and acid deposition and its application to Snowdonia". Atmosphere Environment 40 (18): 3316–3326. doi:10.1016/j.atmosenv.2006.01.043. http://www.sciencedirect.com/science?_ob=ArticleURL&_udi=B6VH3-4JJ2BVK-2&_user=10&_rdoc=1&_fmt=&_orig=search&_sort=d&_docanchor=&view=c&_searchStrId=961742198&_rerunOrigin=google&_acct=C000050221&_version=1&_urlVersion=0&_userid=10&md5=90b8ddaa7dc9c3c004244c7f8dbd95bb.
- ^ a b Robert Penrose Pearce (2002). Meteorology at the Millennium. Academic Press. p. 66. ISBN 978-0-12-548035-2. http://books.google.com/?id=QECy_UBdyrcC&pg=PA66&lpg=PA66&dq=ways+to+moisten+the+atmosphere. Retrieved 2009-01-02.
- ^ Jan Jackson (2008). "All About Mixed Winter Precipitation". National Weather Service. http://www.erh.noaa.gov/rnk/Newsletter/Fall_2008/mixed_precip/Mixed_precip.html. Retrieved 2009-02-07.
- ^ Glossary of Meteorology (June 2000). "Dewpoint". American Meteorological Society. http://amsglossary.allenpress.com/glossary/search?id=dewpoint1. Retrieved 2011-01-31.
- ^ FMI (2007). "Fog And Stratus - Meteorological Physical Background". Zentralanstalt für Meteorologie und Geodynamik. http://www.zamg.ac.at/docu/Manual/SatManu/main.htm?/docu/Manual/SatManu/CMs/FgStr/backgr.htm. Retrieved 2009-02-07.
- ^ Glossary of Meteorology (2009). "Adiabatic Process". American Meteorological Society. http://amsglossary.allenpress.com/glossary/search?id=adiabatic-process1. Retrieved 2008-12-27.
- ^ TE Technology, Inc (2009). "Peltier Cold Plate". http://www.tetech.com/Cold-Plate-Coolers.html. Retrieved 2008-12-27.
- ^ Glossary of Meteorology (2009). "Radiational cooling". American Meteorological Society. http://amsglossary.allenpress.com/glossary/search?p=1&query=radiational+cooling&submit=Search. Retrieved 2008-12-27.
- ^ Robert Fovell (2004). "Approaches to saturation". University of California in Los Angelese. http://www.atmos.ucla.edu/~fovell/AS3downloads/saturation.pdf. Retrieved 2009-02-07.
- ^ National Weather Service Office, Spokane, Washington (2009). "Virga and Dry Thunderstorms". http://www.wrh.noaa.gov/otx/outreach/ttalk/virga.php. Retrieved 2009-01-02.
- ^ Bart van den Hurk and Eleanor Blyth (2008). "Global maps of Local Land-Atmosphere coupling". KNMI. http://www.knmi.nl/~hurkvd/Loco_workshop/Workshop_report.pdf. Retrieved 2009-01-02.
- ^ H. Edward Reiley, Carroll L. Shry (2002). Introductory horticulture. Cengage Learning. p. 40. ISBN 9780766815674. http://books.google.com/?id=jZvsnsLIkNsC&pg=PA40&lpg=PA40&dq=plant+transpiration+adds+moisture+to+air+book#v=onepage&q&f=false. Retrieved 2011-01-31.
- ^ National Weather Service JetStream (2008). "Air Masses". http://www.srh.weather.gov/srh/jetstream/synoptic/airmass.htm. Retrieved 2009-01-02.
- ^ a b Dr. Michael Pidwirny (2008). "CHAPTER 8: Introduction to the Hydrosphere (e). Cloud Formation Processes". Physical Geography. http://www.physicalgeography.net/fundamentals/8e.html. Retrieved 2009-01-01.
- ^ Paul Sirvatka (2003). "Cloud Physics: Collision/Coalescence; The Bergeron Process". College of DuPage. http://weather.cod.edu/sirvatka/bergeron.html. Retrieved 2009-01-01.
- ^ United States Geological Survey (2009). "Are raindrops tear shaped?". United States Department of the Interior. http://ga.water.usgs.gov/edu/raindropshape.html. Retrieved 2008-12-27.
- ^ a b c d J . S. 0guntoyinbo and F. 0. Akintola (1983). "Rainstorm characteristics affecting water availability for agriculture". IAHS Publication Number 140. http://www.cig.ensmp.fr/~iahs/redbooks/a140/iahs_140_0063.pdf. Retrieved 2008-12-27.
- ^ a b Robert A. Houze Jr (1997). "Stratiform Precipitation in Regions of Convection: A Meteorological Paradox?". Bulletin of the American Meteorological Society 78 (10): 2179–2196. Bibcode 1997BAMS...78.2179H. doi:10.1175/1520-0477(1997)078<2179:SPIROC>2.0.CO;2.
- ^ Norman W. Junker (2008). "An ingredients based methodology for forecasting precipitation associated with MCS’s". Hydrometeorological Prediction Center. http://www.hpc.ncep.noaa.gov/research/mcs_web_test_test_files/Page882.htm. Retrieved 2009-02-07.
- ^ a b c d e Alaska Air Flight Service Station (2007-04-10). "SA-METAR". Federal Aviation Administration via the Internet Wayback Machine. Archived from the original on 2008-05-01. http://web.archive.org/web/20080501074014/http://www.alaska.faa.gov/fai/afss/metar+taf/sametara.htm. Retrieved 2009-08-29.
- ^ "Hail (glossary entry)". National Oceanic and Atmospheric Administration's National Weather Service. http://www.weather.gov/glossary/index.php?word=hail. Retrieved 2007-03-20.
- ^ Weatherquestions.com. "What causes ice pellets (sleet)?". http://www.weatherquestions.com/What_causes_ice_pellets.htm. Retrieved 2007-12-08.
- ^ Glossary of Meteorology (2009). "Hail". American Meteorological Society. http://amsglossary.allenpress.com/glossary/search?id=hail1. Retrieved 2009-07-15.
- ^ Ryan Jewell and Julian Brimelow (2004-08-17). "P9.5 Evaluation of an Alberta Hail Growth Model Using Severe Hail Proximity Soundings in the United States". http://www.spc.noaa.gov/publications/jewell/hailslsc.pdf. Retrieved 2009-07-15.
- ^ National Severe Storms Laboratory (2007-04-23). "Aggregate hailstone". National Oceanic and Atmospheric Administration. http://www.photolib.noaa.gov/htmls/nssl0001.htm. Retrieved 2009-07-15.
- ^ Julian C. Brimelow, Gerhard W. Reuter, and Eugene R. Poolman (October 2002). "Modeling Maximum Hail Size in Alberta Thunderstorms". Weather and Forecasting 17 (5): 1048–1062. Bibcode 2002WtFor..17.1048B. doi:10.1175/1520-0434(2002)017<1048:MMHSIA>2.0.CO;2.
- ^ Jacque Marshall (2000-04-10). "Hail Fact Sheet". University Corporation for Atmospheric Research. http://www.ucar.edu/communications/factsheets/Hail.html. Retrieved 2009-07-15.
- ^ a b M. Klesius (2007). "The Mystery of Snowflakes". National Geographic 211 (1): 20. ISSN 0027-9358.
- ^ William J. Broad (2007-03-20). "Giant Snowflakes as Big as Frisbees? Could Be". New York Times. http://www.nytimes.com/2007/03/20/science/20snow.html. Retrieved 2009-07-12.
- ^ Jennifer E. Lawson (2001). Hands-on Science: Light, Physical Science (matter) - Chapter 5: The Colors of Light. Portage & Main Press. p. 39. ISBN 9781894110631. http://books.google.com/?id=4T-aXFsMhAgC&pg=PA39&lpg=PA39. Retrieved 2009-06-28.
- ^ Kenneth G. Libbrecht (2006-09-11). "Guide to Snowflakes". California Institute of Technology. http://www.its.caltech.edu/~atomic/snowcrystals/class/class.htm. Retrieved 2009-06-28.
- ^ John Roach (2007-02-13). ""No Two Snowflakes the Same" Likely True, Research Reveals". National Geographic News. http://news.nationalgeographic.com/news/2007/02/070213-snowflake.html. Retrieved 2009-07-14.
- ^ Kenneth Libbrecht (Winter 2004/2005). "Snowflake Science". American Educator. http://www.aft.org/pubs-reports/american_educator/issues/winter04-05/Snowflake.pdf. Retrieved 2009-07-14.
- ^ Glossary of Meteorology (June 2000). "Diamond Dust". American Meteorological Society. http://amsglossary.allenpress.com/glossary/search?p=1&query=diamond+dust&submit=Search. Retrieved 2010-01-21.
- ^ Kenneth G. Libbrecht (2001). "Morphogenesis on Ice: The Physics of Snow Crystals". Engineering & Science (California Institute of Technology) (1): 12. http://eands.caltech.edu/articles/Libbrecht%20Feature.pdf. Retrieved 2010-01-21.
- ^ a b B. Geerts (2002). "Convective and stratiform rainfall in the tropics". University of Wyoming. http://www-das.uwyo.edu/~geerts/cwx/notes/chap10/con_str.html. Retrieved 2007-11-27.
- ^ David Roth (2006). "Unified Surface Analysis Manual". Hydrometeorological Prediction Center. http://www.hpc.ncep.noaa.gov/sfc/UASfcManualVersion1.pdf. Retrieved 2006-10-22.
- ^ Glossary of Meteorology (2009). "Graupel". American Meteorological Society. http://amsglossary.allenpress.com/glossary/search?p=1&query=graupel&submit=Search. Retrieved 2009-01-02.
- ^ Toby N. Carlson (1991). Mid-latitude Weather Systems. Routledge. p. 216. ISBN 978-0-04-551115-0. http://books.google.com/?id=2lIVAAAAIAAJ&pg=PA216&lpg=PA216&dq=where+convection+occurs+in+the+mid-latitudes. Retrieved 2009-02-07.
- ^ Diana Leone (2002). "Rain supreme". Honolulu Star-Bulletin. http://starbulletin.com/2002/05/27/news/story3.html. Retrieved 2008-03-19.
- ^ Western Regional Climate Center (2002). "Climate of Hawaii". http://www.wrcc.dri.edu/narratives/HAWAII.htm. Retrieved 2008-03-19.
- ^ Paul E. Lydolph (1985). The Climate of the Earth. Rowman & Littlefield. p. 333. ISBN 978-0-86598-119-5. http://books.google.com/?id=bBjIuXHEgZ4C&pg=PA333&lpg=PA333&dq=effect+of+Andes+on+rainfall+in+Chile. Retrieved 2009-01-02.
- ^ Michael A. Mares (1999). Encyclopedia of Deserts. University of Oklahoma Press. p. 252. ISBN 978-0-8061-3146-7. http://books.google.com/?id=g3CbqZtaF4oC&pg=PA252&lpg=PA252&dq=sierra+nevada+leads+to+great+basin+desert. Retrieved 2009-01-02.
- ^ Adam Ganson (2003). "Geology of Death Valley". Indiana University. http://www.indiana.edu/~sierra/papers/2003/Ganson.html. Retrieved 2009-02-07.
- ^ Joan Von Ahn; Joe Sienkiewicz; Greggory McFadden (2005-04). "Hurricane Force Extratropical Cyclones Observed Using QuikSCAT Near Real Time Winds". Mariners Weather Log (Voluntary Observing Ship Program) 49 (1). http://www.vos.noaa.gov/MWL/april_05/cyclones.shtml. Retrieved 2009-07-07.
- ^ Owen Hertzman (1988). Three-Dimensional Kinematics of Rainbands in Midlatitude Cyclones Abstract. PhD thesis. University of Washington. Bibcode 1988PhDT.......110H.
- ^ Yuh-Lang Lin (2007). Mesoscale Dynamics. Cambridge University Press. p. 405. ISBN 9780521808750. http://books.google.com/?id=4KXtnQ3bDeEC&pg=PA405. Retrieved 2009-07-07.
- ^ B. Geerts (1998). "Lake Effect Snow.". University of Wyoming. http://www-das.uwyo.edu/~geerts/cwx/notes/chap10/lake_effect_snow.html. Retrieved 2008-12-24.
- ^ Greg Byrd (1998-06-03). "Lake Effect Snow". University Corporation for Atmospheric Research. http://www.comet.ucar.edu/class/smfaculty/byrd/sld010.htm. Retrieved 2009-07-12.
- ^ Karl W. Birkeland and Cary J. Mock (1996). "Atmospheric Circulation Patterns Associated With Heavy Snowfall Events, Bridger Bowl, Montana, USA". Mountain Research and Development (International Mountain Society) 16 (3): 281–286. doi:10.2307/3673951. JSTOR 3673951. http://www.avalanche.org/~nac/NAC/techPages/articles/96_MRD.pdf.
- ^ Glossary of Meteorology (2009). "Rainy season". American Meteorological Society. http://amsglossary.allenpress.com/glossary/search?id=rainy-season1. Retrieved 2008-12-27.
- ^ Costa Rica Guide (2005). "When to Travel to Costa Rica". ToucanGuides. http://costa-rica-guide.com/when.htm. Retrieved 2008-12-27.
- ^ Michael Pidwirny (2008). "CHAPTER 9: Introduction to the Biosphere". PhysicalGeography.net. http://www.physicalgeography.net/fundamentals/9k.html. Retrieved 2008-12-27.
- ^ Elisabeth M. Benders-Hyde (2003). "World Climates". Blue Planet Biomes. http://www.blueplanetbiomes.org/climate.htm. Retrieved 2008-12-27.
- ^ Mei Zheng (2000). "The sources and characteristics of atmospheric particulates during the wet and dry seasons in Hong Kong". University of Rhode Island. http://digitalcommons.uri.edu/dissertations/AAI9989458/. Retrieved 2008-12-27.
- ^ S. I. Efe, F. E. Ogban, M. J. Horsfall, E. E. Akporhonor (2005). "Seasonal Variations of Physico-chemical Characteristics in Water Resources Quality in Western Niger Delta Region, Nigeria". Journal of Applied Scientific Environmental Management 9 (1): 191–195. ISSN 1119-8362. https://tspace.library.utoronto.ca/bitstream/1807/6445/1/ja05036.pdf. Retrieved 2008-12-27.
- ^ C. D. Haynes, M. G. Ridpath, M. A. J. Williams (1991). Monsoonal Australia. Taylor & Francis. p. 90. ISBN 978-90-6191-638-3. http://books.google.com/?id=ZhvtSmJYuN4C&pg=PA91&lpg=PA91&dq=wet+season+characteristics. Retrieved 2008-12-27.
- ^ a b Marti J. Van Liere, Eric-Alain D. Ategbo, Jan Hoorweg, Adel P. Den Hartog, and Joseph G. A. J. Hautvast (1994). "The significance of socio-economic characteristics for adult seasonal body-weight fluctuations: a study in north-western Benin". British Journal of Nutrition (Cambridge University Press) 72 (3): 479–488. doi:10.1079/BJN19940049. PMID 7947661. http://journals.cambridge.org/download.php?file=%2FBJN%2FBJN72_03%2FS0007114594000504a.pdf&code=40a3bcb87f8abc243d961c531b3262e2.
- ^ Chris Landsea (2007). "Subject: D3 - Why do tropical cyclones' winds rotate counter-clockwise (clockwise) in the Northern (Southern) Hemisphere?". National Hurricane Center. http://www.aoml.noaa.gov/hrd/tcfaq/D3.html. Retrieved 2009-01-02.
- ^ Climate Prediction Center (2005). "2005 Tropical Eastern North Pacific Hurricane Outlook". National Oceanic and Atmospheric Administration. http://www.cpc.ncep.noaa.gov/products/Epac_hurr/Epac_hurricane.html. Retrieved 2006-05-02.
- ^ Jack Williams (2005-05-17). "Background: California's tropical storms". USA Today. http://www.usatoday.com/weather/whhcalif.htm. Retrieved 2009-02-07.
- ^ National Climatic Data Center (2005-08-09). "Global Measured Extremes of Temperature and Precipitation". National Oceanic and Atmospheric Administration. http://www.ncdc.noaa.gov/oa/climate/globalextremes.html. Retrieved 2007-01-18.
- ^ Dr. Owen E. Thompson (1996). Hadley Circulation Cell. Channel Video Productions. Retrieved on 2007-02-11.
- ^ ThinkQuest team 26634 (1999). The Formation of Deserts. Oracle ThinkQuest Education Foundation. Retrieved on 2009-02-16.
- ^ "USGS 220427159300201 1047.0 Mt. Waialeale Rain Gage nr Lihue, Kauai, HI". USGS Real-time rainfall data at Waiʻaleʻale Raingauge. http://waterdata.usgs.gov/hi/nwis/uv?site_no=220427159300201&PARAmeter_cd=00045. Retrieved 2008-12-11.
- ^ USA Today. Mt. Baker snowfall record sticks. Retrieved on 2008-02-29.
- ^ National Weather Service Office, Northern Indiana (2009). "8 Inch Non-Recording Standard Rain Gauge". http://www.crh.noaa.gov/iwx/program_areas/coop/8inch.php. Retrieved 2009-01-02.
- ^ Chris Lehmann (2009). "10/00". Central Analytical Laboratory. http://nadp.sws.uiuc.edu/CAL/2000_reminders-4thQ.htm. Retrieved 2009-01-02.
- ^ National Weather Service Office Binghamton, New York (2009). "Rainguage Information". http://www.erh.noaa.gov/bgm/spotters_skywarn/precip4.shtml. Retrieved 2009-01-02.
- ^ National Weather Service (2009). "Glossary: W". http://www.weather.gov/glossary/index.php?letter=w. Retrieved 2009-01-01.
- ^ Discovery School (2009). "Build Your Own Weather Station". Discovery Education. http://school.discovery.com/lessonplans/activities/weatherstation/itsrainingitspouring.html. Retrieved 2009-01-02.
- ^ "Community Collaborative Rain, Hail & Snow Network Main Page". Colorado Climate Center. 2009. http://cocorahs.org. Retrieved 2009-01-02.
- ^ The Globe Program (2009). "Global Learning and Observations to Benefit the Environment Program". http://www.globe.gov/fsl/welcome/welcomeobject.pl. Retrieved 2009-01-02.
- ^ National Weather Service (2009). "NOAA's National Weather Service Main Page". http://www.nws.noaa.gov. Retrieved 2009-01-01.
- ^ Glossary of Meteorology (June 2000). "Return period". American Meteorological Society. http://amsglossary.allenpress.com/glossary/search?id=return-period1. Retrieved 2009-01-02.
- ^ Glossary of Meteorology (June 2000). "Rainfall intensity return period". American Meteorological Society. http://amsglossary.allenpress.com/glossary/search?p=1&query=return+period&submit=Search. Retrieved 2009-01-02.
- ^ Boulder Area Sustainability Information Network (2005). "What is a 100 year flood?". Boulder Community Network. http://bcn.boulder.co.us/basin/watershed/flood.html. Retrieved 2009-01-02.
- ^ Peel, M. C. and Finlayson, B. L. and McMahon, T. A. (2007). "Updated world map of the Köppen-Geiger climate classification". Hydrol. Earth Syst. Sci. 11: 1633–1644. ISSN 1027-5606. http://www.hydrol-earth-syst-sci.net/11/1633/2007/hess-11-1633-2007.html. (direct: Final Revised Paper)
- ^ Susan Woodward (1997-10-29). "Tropical Broadleaf Evergreen Forest: The Rainforest". Radford University. http://www.radford.edu/~swoodwar/CLASSES/GEOG235/biomes/rainforest/rainfrst.html. Retrieved 2008-03-14.
- ^ Susan Woodward (2005-02-02). "Tropical Savannas". Radford University. http://www.radford.edu/~swoodwar/CLASSES/GEOG235/biomes/savanna/savanna.html. Retrieved 2008-03-16.
- ^ "Humid subtropical climate". Encyclopædia Britannica. Encyclopædia Britannica Online. 2008. http://www.britannica.com/eb/article-53358/climate. Retrieved 2008-05-14.
- ^ Michael Ritter (2008-12-24). "Humid Subtropical Climate". University of Wisconsin–Stevens Point. http://www.uwsp.edu/geo/faculty/ritter/geog101/textbook/climate_systems/humid_subtropical.html. Retrieved 2008-03-16.
- ^ Lauren Springer Ogden (2008). Plant-Driven Design. Timber Press. p. 78. ISBN 9780881928778.
- ^ Michael Ritter (2008-12-24). "Mediterranean or Dry Summer Subtropical Climate". University of Wisconsin–Stevens Point. http://www.uwsp.edu/geo/faculty/ritter/geog101/textbook/climate_systems/mediterranean.html. Retrieved 2009-07-17.
- ^ Brynn Schaffner and Kenneth Robinson (2003-06-06). "Steppe Climate". West Tisbury Elementary School. http://www.blueplanetbiomes.org/steppe_climate_page.htm. Retrieved 2008-04-15.
- ^ Michael Ritter (2008-12-24). "Subarctic Climate". University of Wisconsin–Stevens Point. http://www.uwsp.edu/geo/faculty/ritter/geog101/textbook/climate_systems/subarctic.html. Retrieved 2008-04-16.
- ^ Bureau of Meteorology (2010). "Living With Drought". Commonwealth of Australia. http://www.bom.gov.au/climate/drought/livedrought.shtml. Retrieved 2010-01-15.
- ^ Robert Burns (2007-06-06). "Texas Crop and Weather". Texas A&M University. http://agnewsarchive.tamu.edu/dailynews/stories/CROP/Jun0607a.htm. Retrieved 2010-01-15.
- ^ James D. Mauseth (2006-07-07). "Mauseth Research: Cacti". University of Texas. http://www.sbs.utexas.edu/mauseth/researchoncacti/. Retrieved 2010-01-15.
- ^ A. Roberto Frisancho (1993). Human Adaptation and Accommodation. University of Michigan Press, pp. 388. ISBN 9780472095117. Retrieved on 2008-12-27.
- ^ Climate Change Division (2008-12-17). "Precipitation and Storm Changes". United States Environmental Protection Agency. http://www.epa.gov/climatechange/science/recentpsc.html. Retrieved 2009-07-17.
- ^ Dale Fuchs (2005-06-28). "Spain goes hi-tech to beat drought". London: The Guardian. http://www.guardian.co.uk/weather/Story/0,2763,1516375,00.html. Retrieved 2007-08-02.
- ^ Goddard Space Flight Center (2002-06-18). "NASA Satellite Confirms Urban Heat Islands Increase Rainfall Around Cities". National Aeronautics and Space Administration. http://www.gsfc.nasa.gov/topstory/20020613urbanrain.html. Retrieved 2009-07-17.[dead link]
- ^ Jack S. Bushong (1999). "Quantitative Precipitation Forecast: Its Generation and Verification at the Southeast River Forecast Center". University of Georgia. http://cms.ce.gatech.edu/gwri/uploads/proceedings/1999/BushongJ-99.pdf. Retrieved 2008-12-31.
- ^ Daniel Weygand (2008). "Optimizing Output From QPF Helper". National Weather Service Western Region. http://www.wrh.noaa.gov/wrh/talite0821.pdf. Retrieved 2008-12-31.
- ^ Noreen O. Schwein (2009). "Optimization of quantitative precipitation forecast time horizons used in river forecasts". American Meteorological Society. http://ams.confex.com/ams/89annual/techprogram/paper_149707.htm. Retrieved 2008-12-31.
- ^ Christian Keil, Andreas Röpnack, George C. Craig, and Ulrich Schumann (2008-12-31). "Sensitivity of quantitative precipitation forecast to height dependent changes in humidity". Geophysical Research Letters 35 (9): L09812. Bibcode 2008GeoRL..3509812K. doi:10.1029/2008GL033657. http://www.agu.org/pubs/crossref/2008/2008GL033657.shtml.
- ^ P. Reggiani and A. H. Weerts (2007). "Probabilistic Quantitative Precipitation Forecast for Flood Prediction: An Application". Journal of Hydrometeorology 9 (1): 76–95. Bibcode 2008JHyMe...9...76R. doi:10.1175/2007JHM858.1. http://ams.allenpress.com/perlserv/?request=get-abstract&doi=10.1175%2F2007JHM858.1&ct=1. Retrieved 2008-12-31.
- ^ Charles Lin (2005). "Quantitative Precipitation Forecast (QPF) from Weather Prediction Models and Radar Nowcasts, and Atmospheric Hydrological Modelling for Flood Simulation". Achieving Technological Innovation in Flood Forecasting Project. http://www.actif-ec.net/Workshop2/Presentations/ACTIF_P_S1_02.pdf. Retrieved 2009-01-01.
External links
- World precipitation map
- Collision/Coalescence; The Bergeron Process
- Report local rainfall inside the United States at this site (CoCoRaHS)
- Report local rainfall related to tropical cyclones worldwide at this site
- Global Precipitation Climatology Center GPCC
- Types of rainfall (BBC)
Meteorological data and variables General Adiabatic processes · Lapse rate · Lightning · Surface solar radiation · Surface weather analysis · Visibility · Vorticity · WindCondensation Cloud · Cloud condensation nuclei · Fog · Lifted condensation level (LCL) · Precipitation · Water vaporConvection Temperature Dew point (Td) · Equivalent temperature (Te) · Forest fire weather index · Haines Index · Heat index · Humidex · Humidity · Potential temperature (θ) · Equivalent potential temperature (θe) · Sea surface temperature (SST) · Wet-bulb temperature · Wet-bulb potential temperature · Wind chillPressure Categories:- Basic meteorological concepts and phenomena
- Precipitation


Wikimedia Foundation. 2010.