- Economy of Chile
-
Economy of Chile 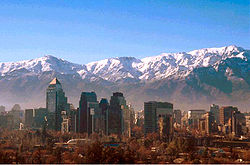
The "Sanhattan" district of SantiagoCurrency Chilean peso (CLP) Fiscal year calendar year Trade organisations WTO, APEC, Mercosur (associate), CAN (associate) Statistics GDP $203.925 billion (2010)[1] GDP growth 5.2% (2010)[1], 8.4% (1H 2011)[2] GDP per capita $11,929 (2010)[1] GDP by sector agriculture & mining: 22.5%, industry: 25.2%, services: 52.3% (2008)[3] Inflation (CPI) 3.0% (2010, dec./dec.)[1] Population
below poverty line11.5% (2009)[4] Gini index 0.503 (2006)[5] Labour force 7.74 million (2010)[6] Labour force
by occupationagriculture: 13.2%, industry: 23%, services: 63.9% (2005) Unemployment 8.2% (2010)[6] Average gross salary $8,002 (2009)[7] Main industries copper, other minerals, foodstuffs, fish processing, iron and steel, wood and wood products, transport equipment, cement, textiles Ease of Doing Business Rank 43rd[8] External Exports $71.029 billion fob (2010, goods)[1] Export goods copper, fruit, fish products, paper and pulp, chemicals, wine Main export partners China 16.46%, U.S. 11.31%, Japan 9.06%, Brazil 4.64%, Mexico 4.09% (2009) Imports $55.174 billion fob (2010, goods)[1] Import goods petroleum and petroleum products, chemicals, electrical and telecommunications equipment, industrial machinery, vehicles, natural gas Main import partners U.S. 21.77%, China 12.76%, Argentina 9.55%, Brazil 6.46%, South Korea 5.35% (2009) FDI stock $115 billion (31 December 2009 est.) Gross external debt $86.738 billion (2010)[1] Public finances Public debt 6.1% of GDP (2009, central government)[9] Revenues $32.75 billion (2009 est.) Expenses $39.96 billion (2009 est.) Economic aid $0 million (2006) Foreign reserves $27.864 billion (2010, net)[1] Main data source: CIA World Fact Book
All values, unless otherwise stated, are in US dollarsThe economy of Chile is ranked as an upper-middle income economy by the World Bank,[10] and is one of South America's most stable and prosperous nations,[11] leading Latin American nations in human development, competitiveness, income per capita, globalization, economic freedom, and low perception of corruption.[12] However, it has a high economic inequality, as measured by the Gini index.[13]
In May 2010 Chile became the first South American country to join the OECD.[14] In 2006, Chile became the country with the highest nominal GDP per capita in Latin America.[15] Chile has an inequality-adjusted human development index of 0.634, compared to 0.509 and 0.562 for neighbouring Brazil and Argentina, respectively. 5.3% of the population lives on less than US $2 a day.[16]
The Global Competitiveness Report for 2009-2010 ranks Chile as being the 30th most competitive country in the world and the first in Latin America, well above from Brazil (56th), Mexico (60th) and Argentina which ranks 85th.[15] The Ease of doing business index created by the World Bank lists Chile as 43rd in the world that encompasses better, usually simpler, regulations for businesses and stronger protections of property rights.[8] The privatized national pension system (AFP) has encouraged domestic investment and contributed to an estimated total domestic savings rate of approximately 21% of GDP.[17]
Contents
History
Main article: Economic history of ChileAfter Spanish conquest in the 16th century Chilean economy came to revolve around autarchyc estates called fundos and around the army that was engaged in the Arauco War. During early colonial times there were gold exports to Perú from placer deposits which soon depleted. Trade restrictions and monopolies established by the Spanish crown are credited for having held back economic development for much of the colonial times. As effect of these restrictions the country incorporated very few new crops and animal breeds after initial conquest. Other sectors that were held back by restrictions were the wine and mining industries. The Bourbon reforms in the 18th century eased many monopolies and trade restrictions.
In the 1830s Chile consolidated under the ideas of Diego Portales as a stable state open to foreign trade. Foreign investment in Chile grew over the 19th century. After the War of the Pacific the Chilean treasury grew by 900%. The League of Nations labeled Chile the country hardest hit by the Great Depression because 80% of government revenue came from exports of copper and nitrates, which were in low demand. After the Great Depression Chilean economic policies changed toward import substitution industrialization and the Production Development Corporation was established.
Under the influence of the Chicago Boys the Pinochet regime made of Chile a leading country in establishing neoliberal policies which are attributed to have lifted the country to become one of the richest in Latin America. Despite a general selling of state property the regime retained the lucrative state owned mining company CODELCO which stands for about 30% of government income.
According to the CIA World Factbook, during the early 1990s, Chile's "reputation as a role model for economic reform" was strengthened when the democratic government of Patricio Aylwin, who took over from the military in 1990, deepened the economic reform initiated by the military government. Growth in real GDP averaged 8% from 1991–1997,[citation needed] but fell to half that level in 1998 because of tight monetary policies (implemented to keep the current account deficit in check) and because of lower export earnings, the latter which was a product of the Asian financial crisis. Chile's economy has since recovered and has seen growth rates of 5-7% over the past several years.[citation needed]
After a decade of impressive growth rates, Chile began to experience a moderate economic downturn in 1999, brought on by unfavorable global economic conditions related to the Asian financial crisis, which began in 1997. The economy remained sluggish until 2003, when it began to show clear signs of recovery, achieving 4.0% real GDP growth.[18] The Chilean economy finished 2004 with growth of 6.0%. Real GDP growth reached 5.7% in 2005 before falling back to 4.0% in 2006. GDP expanded by 5.1% in 2007.[19]
Sectors
Agriculture
Main article: Agriculture in ChileAgriculture and allied sectors like forestry, logging and fishing accounts only for 4.9% of the GDP as of 2007 and employed 13.6% of the country's labor force. Some major agriculture products of Chile includes grapes, apples, pears, onions, wheat, corn, oats, peaches, garlic, asparagus, beans, beef, poultry, wool, fish and timber.[20]
Chile’s position in the Southern Hemisphere leads to an agricultural season cycle opposite to those of the principal consumer markets, primarily located in the Northern Hemisphere.[21] Chile’s extreme north-south orientation produces 7 different macro-regions distinguished by climate and geographical features, which allows the country itself to stagger harvests and results in extended harvesting seasons.[21] However, the mountainous landscape of Chile limits the extent and intensity of agriculture so that arable land corresponds only to 2.62% of the total territory.[20] Through Chile’s trade agreements, its agricultural products have gained access to a market controlling 77% of the world’s GDP and by approximately 2012, 74% of Chilean agribusiness exports will be duty free.[21]
Chiles principal growing region and agricultural heartland is the Central Valley delimited by the Chilean Coast Range in the west, the Andes in the east Aconcagua River by the north and Bío-Bío River by the south. In the northern half of Chile cultivation is highly dependent on irrigation. South of the Central Valley cultivation is gradually replaced by aquaculture, silviculture, sheep and cattle farming.
Salmon
Chile is the second largest producer of salmon in the world.[21] As of August 2007, Chile’s share of worldwide salmon industry sales was 38.2%, rising from just 10% in 1990.[21] The average growth rate of the industry for the 20 years between 1984 and 2004 was 42% per year.[21] The presence of large foreign firms in the salmon industry has brought what probably most contributes to Chile’s burgeoning salmon production, technology.[21] Technology transfer has allowed Chile to build its global competitiveness and innovation and has led to the expansion of production as well as to an increase in average firm size in the industry.[21]
Forestry
The Chilean forestry industry grew to comprise 13% of the country’s total exports in 2005, making it one of the largest export sectors for Chile.[21] Radiata Pine and Eucalyptus comprise the vast majority of Chile's forestry exports.[21] Within the forestry sector, the largest contributor to total production is pulp, followed by wood-based panels and lumber.[21] Due to popular and increasing demands for Chile’s forestry products, the government is currently focusing on increasing the already vast acreage of Chile’s Pine and Eucalyptus plantations as well as opening new industrial plants.[21]
Mining
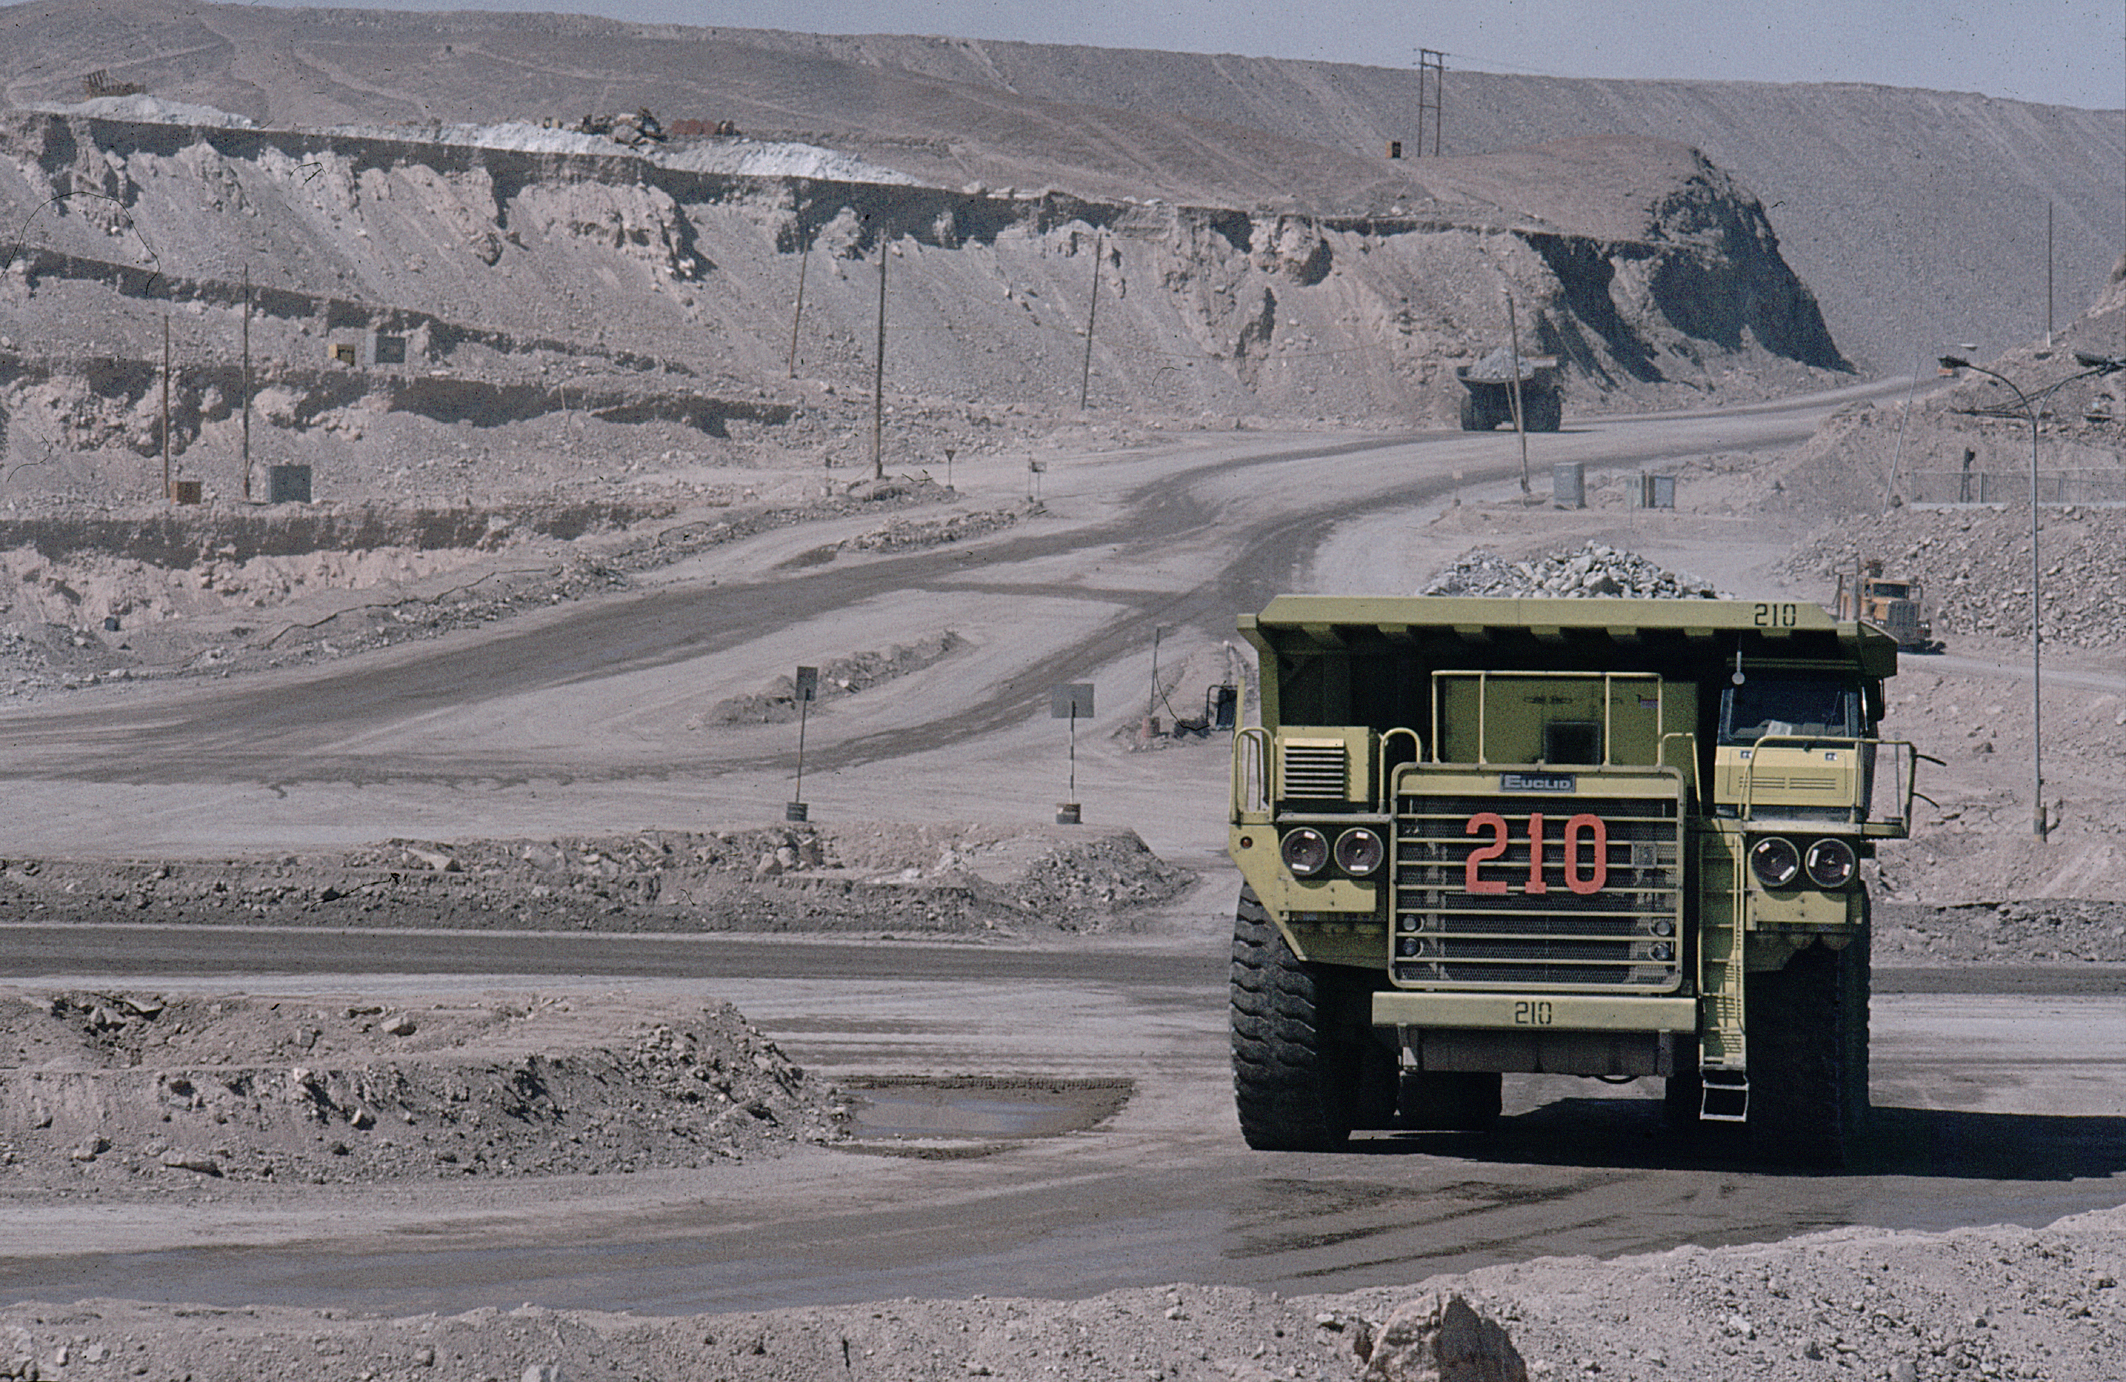
See also: Mining in Chile Chile produces more than a third of the world's copper.
The mining sector in Chile is one of the pillars of Chilean economy. The Chilean government strongly supports foreign investment in the sector and has modified its mining industry laws and regulations to create a favorable investing environment for foreigners. Thanks to a large amount of copper resources, progressive legislation and a healthy investment environment, Chile has become the copper mining capital of the world, producing over 1/3 of the global copper output.[21]
Services
Finance
Chile's financial sector has grown quickly in recent years, with a banking reform law approved in 1997 that broadened the scope of permissible foreign activity for Chilean banks. The Chilean Government implemented a further liberalization of capital markets in 2001, and there is further pending legislation proposing further liberalization. Over the last ten years, Chileans have enjoyed the introduction of new financial tools such as home equity loans, currency futures and options, factoring, leasing, and debit cards. The introduction of these new products has also been accompanied by an increased use of traditional instruments such as loans and credit cards. Chile's private pension system, with assets worth roughly $70 billion at the end of 2006, has been an important source of investment capital for the capital market. However, by 2009, it has been reported that $21 billion had been lost from the pension system to the global financial crisis.[22]
Tourism
Main article: Tourism in ChileTourism in Chile has experienced sustained growth over the last decades. Chile received about 2.25 million foreign visitors in 2006,[23] up to 2.50 million in 2007 [24] The percentages of foreign tourists arrivals by land, air and sea were, respectively, 55.3%, 40.5% and 4.2% for that year.[23] The two main gateways for international tourists visiting Chile are Comodoro Arturo Merino Benítez International Airport and Paso Los Libertadores.
Chile a great diversity of natural landscapes, from the Mars-like landscapes of the hyperarid Atacama Desert to the glacier-fed fjords of the Chilean Patagonia, passing by the winelands backdropped by the Andes of the Central Valley and the old-growth forests of the Lakes District. Easter Island and Juan Fernández Archipelago, including Robinson Crusoe Island, are also major attractions.
Many of the most visited attractions in Chile are protected areas. The extensive Chilean protected areas system includes 32 national parks, 48 natural reserves and 15 natural monuments.[23]
Economic policies

According to the CIA World Factbook, Chile's "sound economic policies," maintained consistently since the 1980s, "have contributed to steady economic growth in Chile and have more than halved poverty rates."[19][20] The 1973-90 military government sold many state-owned companies, and the three democratic governments since 1990 have continued privatization, though at a slower pace. The government's role in the economy is mostly limited to regulation, although the state continues to operate copper giant CODELCO and a few other enterprises (there is one state-run bank). Chile is strongly committed to free trade and has welcomed large amounts of foreign investment. Chile has signed free trade agreements (FTAs) with a whole network of countries, including an FTA with the United States that was signed in 2003 and implemented in January 2004.[25]
Chile's independent Central Bank pursues an inflation target of between 2% and 4%. Inflation has not exceeded 5% since 1998. Chile registered an inflation rate of 3.2% in 2006. The Chilean peso's rapid appreciation against the U.S. dollar in recent years has helped dampen inflation. Most wage settlements and loans are indexed, reducing inflation's volatility. Under the compulsory private pension system, most formal sector employees pay 10% of their salaries into privately managed funds.[19]
As of 2006, Chile invested only 0.6% of its annual GDP in research and development (R&D). Even then, two-thirds of that was government spending. Beyond its general economic and political stability, the government has also encouraged the use of Chile as an "investment platform" for multinational corporations planning to operate in the region, but this will have limited value given the developing business climate in Chile itself.[specify] Chile's approach to foreign direct investment is codified in the country's Foreign Investment Law, which gives foreign investors the same treatment as Chileans. Registration is reported to be simple and transparent, and foreign investors are guaranteed access to the official foreign exchange market to repatriate their profits and capital.[19]
Faced with an international economic downturn the government announced a $4 billion economic stimulus plan to spur employment and growth, and despite the global financial crisis, aimed for an expansion of between 2 percent and 3 percent of GDP for 2009. Nonetheless, economic analysts disagreed with government estimates and predicted economic growth at a median of 1.5 percent.[26] According to the CIA World FactBook, the GDP contracted an estimated -1.7% in 2009.[citation needed]
The Chilean Government has formed a Council on Innovation and Competition, which is tasked with identifying new sectors and industries to promote. It is hoped that this, combined with some tax reforms to encourage domestic and foreign investment in research and development, will bring in additional FDI to new parts of the economy.[19]
Chile maintains one of the best credit ratings (S&P A+) in Latin America.[27] There are three main ways for Chilean firms to raise funds abroad: bank loans, issuance of bonds, and the selling of stocks on U.S. markets through American Depository Receipts (ADRs). Nearly all of the funds raised through these means go to finance domestic Chilean investment. The government is required by law to run a fiscal surplus of at least 1% of GDP. In 2006, the Government of Chile ran a surplus of $11.3 billion, equal to almost 8% of GDP. The Government of Chile continues to pay down its foreign debt, with public debt only 3.9% of GDP at the end of 2006.[19]
Foreign trade

2006 was a record year for Chilean trade. Total trade registered a 31% increase over 2005. During 2006, exports of goods and services totaled US $58 billion, an increase of 41%. This figure was somewhat distorted by the skyrocketing price of copper. In 2006, copper exports reached a historical high of US $33.3 billion. Imports totaled US $35 billion, an increase of 17% compared to the previous year. Chile thus recorded a positive trade balance of US $23 billion in 2006.[19]
The main destinations for Chilean exports were the Americas (US $39 billion), Asia (US $27.8 billion) and Europe (US $22.2 billion). Seen as shares of Chile's export markets, 42% of exports went to the Americas, 30% to Asia and 24% to Europe. Within Chile's diversified network of trade relationships, its most important partner remained the United States. Total trade with the U.S. was US $14.8 billion in 2006. Since the U.S.-Chile Free Trade Agreement went into effect on January 1, 2004, U.S.-Chilean trade has increased by 154%. Internal Government of Chile figures show that even when factoring out inflation and the recent high price of copper, bilateral trade between the U.S. and Chile has grown over 60% since then.[19]
Total trade with Europe also grew in 2006, expanding by 42%. The Netherlands and Italy were Chile's main European trading partners. Total trade with Asia also grew significantly at nearly 31%. Trade with Korea and Japan grew significantly, but China remained Chile's most important trading partner in Asia. Chile's total trade with China reached U.S. $8.8 billion in 2006, representing nearly 66% of the value of its trade relationship with Asia.[19]
The growth of exports in 2006 was mainly caused by a strong increase in sales to the United States, the Netherlands, and Japan. These three markets alone accounted for an additional US $5.5 billion worth of Chilean exports. Chilean exports to the United States totaled US $9.3 billion, representing a 37.7% increase compared to 2005 (US $6.7 billion). Exports to the European Union were US $15.4 billion, a 63.7% increased compared to 2005 (US $9.4 billion). Exports to Asia increased from US $15.2 billion in 2005 to US $19.7 billion in 2006, a 29.9% increase.[19]
During 2006, Chile imported US $26 billion from the Americas, representing 54% of total imports, followed by Asia at 22%, and Europe at 16%. Mercosur members were the main suppliers of imports to Chile at US $9.1 billion, followed by the United States with US $5.5 billion and the European Union with US $5.2 billion. From Asia, China was the most important exporter to Chile, with goods valued at US $3.6 billion. Year-on-year growth in imports was especially strong from a number of countries-Ecuador (123.9%), Thailand (72.1%), Korea (52.6%), and China (36.9%).[19]
Chile's overall trade profile has traditionally been dependent upon copper exports. The state-owned firm CODELCO is the world's largest copper-producing company, with recorded copper reserves of 200 years. Chile has made an effort to expand nontraditional exports. The most important non-mineral exports are forestry and wood products, fresh fruit and processed food, fishmeal and seafood, and wine.[19]
Trade agreements
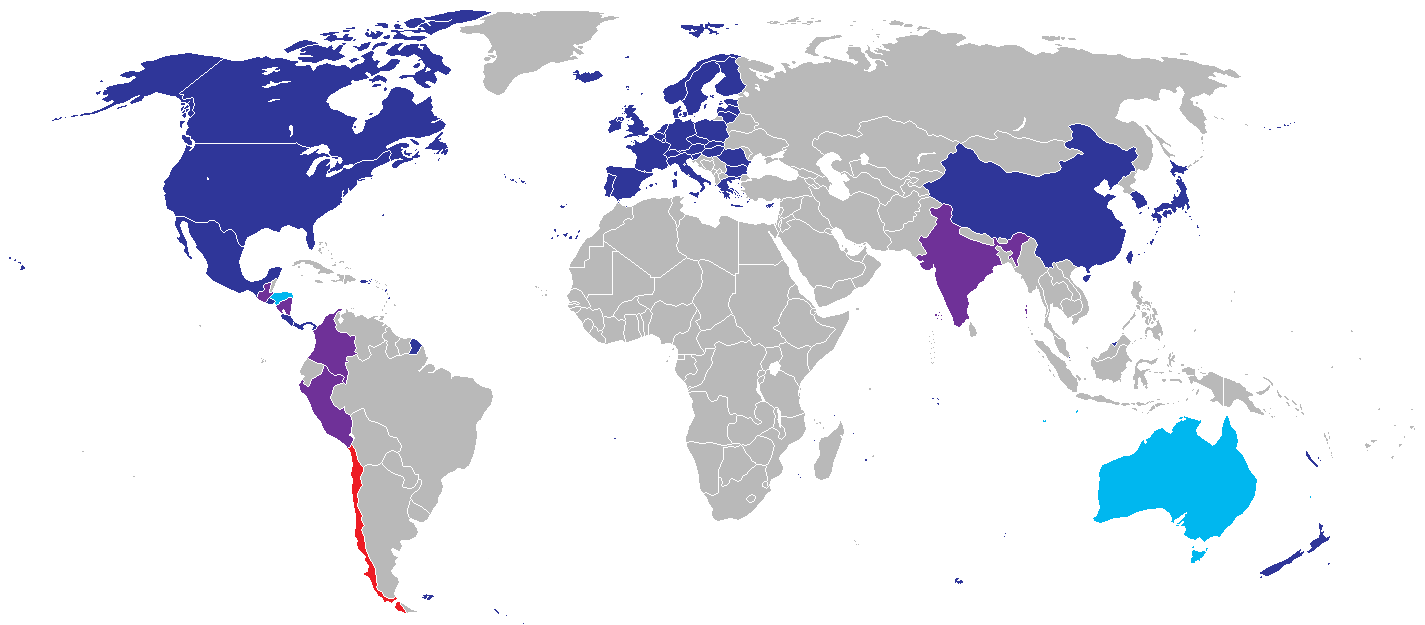
 Nations that have an FTA with Chile appear in dark blue, those that have not ratified a negotiated FTA in light blue, and those in FTA negotiations in purple. Chile is in red.
Over the last several years, Chile has signed FTAs with the European Union, South Korea, New Zealand, Singapore, Brunei, China, and Japan. It reached a partial trade agreement with India in 2005 and began negotiations for a full-fledged FTA with India in 2006. Chile conducted trade negotiations in 2007 with Australia, Malaysia, and Thailand, as well as with China to expand an existing agreement beyond just trade in goods. Chile concluded FTA negotiations with Australia and an expanded agreement with China in 2008. The members of the P4 (Chile, Singapore, New Zealand, and Brunei) also plan to conclude a chapter on finance and investment in 2008.[19]
Successive Chilean governments have actively pursued trade-liberalizing agreements. During the 1990s, Chile signed free trade agreements (FTA) with Canada, Mexico, and Central America. Chile also concluded preferential trade agreements with Venezuela, Colombia, and Ecuador. An association agreement with Mercosur-Argentina, Brazil, Paraguay, and Uruguay-went into effect in October 1996. Continuing its export-oriented development strategy, Chile completed landmark free trade agreements in 2002 with the European Union and South Korea. Chile, as a member of the Asia-Pacific Economic Cooperation (APEC) organization, is seeking to boost commercial ties to Asian markets. To that end, it has signed trade agreements in recent years with New Zealand, Singapore, Brunei, India, China, and most recently Japan. In 2007, Chile held trade negotiations with Australia, Thailand, Malaysia, and China. In 2008, Chile hopes to conclude an FTA with Australia, and finalize an expanded agreement (covering trade in services and investment) with China. The P4 (Chile, Singapore, New Zealand, and Brunei) also plan to expand ties through adding a finance and investment chapter to the existing P4 agreement. Chile's trade talks with Malaysia and Thailand are also scheduled to continue in 2008.[19]
After two years of negotiations, the United States and Chile signed an agreement in June 2003 that will lead to completely duty-free bilateral trade within 12 years. The U.S.-Chile FTA entered into force January 1, 2004, following approval by the U.S. and Chilean congresses. The bilateral FTA has inaugurated greatly expanded U.S.-Chilean trade ties, with total bilateral trade jumping by 154% during the FTA's first three years.[19]
Chile unilaterally lowered its across-the-board import tariff for all countries with which it does not have a trade agreement to 6% in 2003. Higher effective tariffs are charged only on imports of wheat, wheat flour, and sugar as a result of a system of import price bands. The price bands were ruled inconsistent with Chile's World Trade Organization (WTO) obligations in 2002, and the government has introduced legislation to modify them. Under the terms of the U.S.-Chile FTA, the price bands will be completely phased out for U.S. imports of wheat, wheat flour, and sugar within 12 years.[19]
Chile is a strong proponent of pressing ahead on negotiations for a Free Trade Area of the Americas (FTAA) and is active in the WTO's Doha round of negotiations, principally through its membership in the G-20 and Cairns Group.[19]
Issues
Unemployment hovered at 8%-10% after the start of the economic slowdown in 1999, above the 7% average for the 1990s. Unemployment finally dipped to 7.8% in 2006, and continued to fall in 2007, averaging 6.8% monthly (up to August).[29] Wages have risen faster than inflation as a result of higher productivity, boosting national living standards. The percentage of Chileans with household incomes below the poverty line – defined as twice the cost of satisfying a person's minimal nutritional needs – fell from 45.1% in 1987 to 13.7% in 2006, according to government polls.[30] Critics in Chile, however, argue that poverty figures are considerably higher than those officially published. (The government constructs the poverty line based on an outdated 1987 household consumption poll, instead of more recent polls from 1997 or 2007). According to these critics who use data from the 1997 poll, the poverty rate rises to 29%.[31] Using the relative yardstick favoured in many European countries, 27% of Chileans would be poor, according to Juan Carlos Feres of the ECLAC.[32]
Total foreign direct investment (FDI) was only $3.4 billion in 2006, up 52% from a poor performance in 2005. However, 80% of FDI continues to go to only four sectors: electricity, gas, water and mining. Much of the jump in FDI in 2006 was also the result of acquisitions and mergers, but has done little to create new employment in Chile.[citation needed]
The percent of total income earned by the richest 20% of the Chilean population in 2000 was 61.0% of GDP, while the percent of total income earned by the poorest 20% of the Chilean population was 3.3% of GDP.[33] Chile's Gini Coefficient in 2003 (53.8) has slightly changed in comparison with the value in 1995 (56.4). In 2005 the 10% poorest among the Chileans received 1.2% of GNP (2000 = 1.4%), while the 10% richest received 47% of GNP (2000 = 46%).[34]
Statistics
GDP composition
Main macroeconomic aggregates of GDP.
Sector 2003-09 (%) 2009 (%) Private consumption 58.3 59.8 Government consumption 11.6 13.4 Changes in inventories 0.4 -2.4 Gross fixed capital formation 20.8 21.4 (Exports) (42.1) (38.1) (Imports) (33.1) (30.4) Exports - Imports 8.9 7.8 GDP 100.00 100.00 Note: 2007 data are provisional, 2008-09 data are preliminary. Source: Central Bank of Chile, accessed on March 28, 2010.
GDP by sector
Gross domestic product by sector of the economy.
Sector 2003-09 (%) 2009 (%) Agriculture and forestry 3.1 2.6 Fishing 1.0 0.8 Mining - Copper
- Rest
17.4
15.6
1.816.4
14.4
2.0Manufacturing industry 14.8
4.6
0.6
0.9
1.4
3.8
1.4
2.112.7
4.7
0.3
0.5
1.1
2.9
1.0
2.2Electricity, gas and water 3.3 5.0 Construction 7.1 8.0 Retail, restaurants and hotels 9.4 9.4 Transportation 6.3 5.8 Communications 2.2 2.3 Financial services 15.1 15.9 Real estate 5.2 5.1 Personal services (health, education, and so on.) 10.9 11.8 Public administration 4.2 4.5 GDP subtotal 100.0 100.0 GDP rest 5.3 5.6 GDP total
millions of current Chilean pesos
billions of current U.S. dollars100.0
—
—100.0
91,591,252
163.670Note: 2007 data are provisional, 2008-09 data are preliminary. GDP subtotal does not include VAT taxes and import duties (ID); includes imputed bank fees (IB). GDP total = GDP subtotal - IB + VAT + ID. Source: Central Bank of Chile, accessed on March 28, 2010.
Top exports
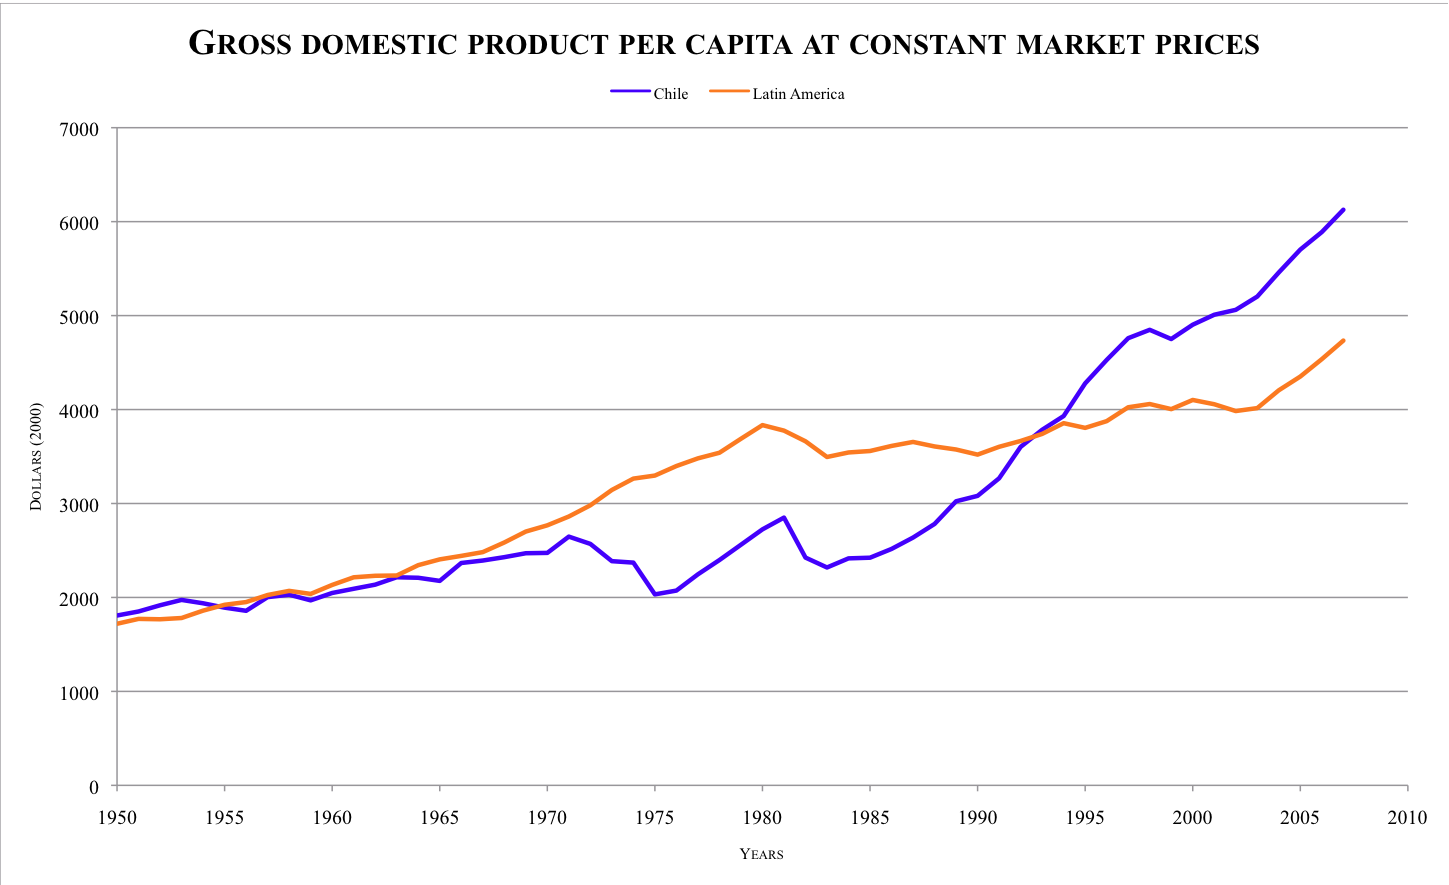
 Chile's exports in 1950-2007
Chile's top exports in 2008.
Export % Mining 49.46
42.49
4.36Agriculture, forestry and fishing 5.04
4.33
1.63Industrial 27.45
9.03
3.01
1.78
2.78
4.27
4.94
2.15Other 4.11 Goods total 86.07 Transport 8.26
5.22
2.62Travel 2.28 Other 3.39 Services total 13.93 Total exports
billions of US dollars FOB100.00
77.210Note: Provisional data provided by the Chilean Central Bank's statistics database.
See also
- South America Life Quality Rankings - Economy and Finance
References
- ^ a b c d e f g h Macroeconomic Indicators as of quarter IV, 2010, Central Bank of Chile, accessed on April 19, 2011.
- ^ Economía chilena registra crecimiento de 8,4% durante el primer semestre, El Mercurio, August 18, 2011.
- ^ "Central Bank of Chile". Si2.bcentral.cl. http://si2.bcentral.cl/Basededatoseconomicos/951_417.asp?m=CN_B03_25&f=A&i=E. Retrieved 2010-01-31.
- ^ Panorama social de América Latina, ECLAC, 2010.
- ^ OECD (2011), Society at a Glance – OECD Social Indicators - KEY FINDINGS: CHILE, OECD, April 2011.
- ^ a b "National Statistics Office". http://www.ine.cl/canales/chile_estadistico/mercado_del_trabajo/nene/mensuales/Mensuales_CV.xls. Retrieved 2011-04-19.
- ^ Remuneraciones y Costos Medios - INFORME ANUAL 2009, National Statistics Institute of Chile (p. 12). Accessed on April 19, 2011. Note: The monthly mean salary for 2009 was 373,221 Chilean pesos in nominal prices. That figure was multiplied by 12 and divided by 559.7, the value in Chilean pesos of 1 US dollar in 2009. The value of the US dollar was obtained from "Macroeconomic Indicators as of quarter IV, 2010", Central Bank of Chile, accessed on April 19, 2011.
- ^ a b "Doing Business in Chile 2010". World Bank. http://www.doingbusiness.org/ExploreEconomies/?economyid=41. Retrieved 2010-08-20.
- ^ "Indicadores Macroeconómicos". Central Bank of Chile. 2010-05-31. http://www.bcentral.cl/publicaciones/estadisticas/informacion-integrada/pdf/im_primer2010.pdf. Retrieved 2010-06-01.
- ^ Chile – World Bank
- ^ "Country profile: Chile". BBC News. 2009-12-16. http://news.bbc.co.uk/2/hi/americas/country_profiles/1222764.stm. Retrieved 2009-12-31.
- ^ "Human and income poverty: developing countries". UNDP. http://hdrstats.undp.org/indicators/25.html. Retrieved 2008-05-19.
- ^ "Encuesta Casen". Mideplan. 2007. http://www.mideplan.cl/final/bajar.php?path=casen2006regional&id=Imp_Distrib.pdf.[dead link]
- ^ "Chile's accession to the OECD". OECD.org. 7 May 2010. http://www.oecd.org/document/11/0,3343,en_33873108_39418658_45115147_1_1_1_1,00.html. Retrieved 2010-05-07.
- ^ a b http://www.weforum.org/pdf/GCR09/GCR20092010fullrankings.pdf
- ^ "HDI". UNDP. http://hdr.undp.org/en/media/HDI_2008_EN_Tables.pdf.
- ^ [1] The Chilean pension system
- ^ [2] Chile GDP – real growth rate
- ^ a b c d e f g h i j k l m n o p q "Development and Breakdown of Democracy, 1830-1973". Country Studies. Library of Congress. 1994-03-31. http://countrystudies.us/chile/85.htm.
- ^ a b c Chile entry at The World Factbook
- ^ a b c d e f g h i j k l m Amcham Chile
- ^ "An uncertain future". GlobalPost. http://www.globalpost.com/dispatch/chile/090121/uncertain-future. Retrieved 2009-12-17.
- ^ a b c "2006 Tourism Report". INE. Archived from the original on 2008-07-30. http://web.archive.org/web/20080730174532/http://www.ine.cl/canales/chile_estadistico/estadisticas_economicas/turismo/infoanual/informesanuales.php. Retrieved 2008-08-05.
- ^ http://www.tourismroi.com/Content_Attachments/27670/File_633513750035785076.pdf
- ^ [3] USA-Chile FTA Final Text
- ^ "Chile finmin says no recession seen in 2009-report". Reuters. 2009-01-10. http://www.reuters.com/article/economicNews/idUSN1027661220090110. Retrieved 2009-12-17.
- ^ [4] Chile: Overview of economy
- ^ "Chile ranks fifth globally in wine exports and eighth in production". Santiago Times. http://en.mercopress.com/2010/06/25/chile-ranks-fifth-globally-in-wine-exports-and-eighth-in-production.
- ^ "Chilean Central Bank". http://si2.bcentral.cl/Basededatoseconomicos/951_417.asp?m=EMP03&f=M&i=E.
- ^ "Casen 2006 en profundidad". Libertad y Desarrollo. 2007-06-22. Archived from the original on 2007-10-25. http://web.archive.org/web/20071025021053/http://www.trabajoyequidad.cl/documentos/temp/TP-825-CASEN+2006+en+profundidad-22-06-2007.pdf. Retrieved 2007-10-22.
- ^ "Una muy necesaria corrección: Hay cuatro millones de pobres en Chile". El Mercurio. 2007-10-14. http://www.economiaynegocios.cl/noticias/noticias.asp?id=35048. Retrieved 2007-10-22.
- ^ "Destitute no more". The Economist. 2007-08-16. http://www.economist.com/displaystory.cfm?story_id=9645174. Retrieved 2007-10-22. (subscription required)
- ^ "eco_cou_152.xls" (PDF). http://earthtrends.wri.org/pdf_library/country_profiles/eco_cou_152.pdf. Retrieved 2010-01-31.
- ^ "Document of Strategy Chile" (PDF). http://ec.europa.eu/external_relations/chile/csp/07_13_en.pdf. Retrieved 2010-01-31.
Bibliography
- COLLIER, Simon and Sater, William F. A History of Chile, 1808-2002, New York and London, Cambridge University Press, 2004.
- CONSTABLE, Pamela and Valenzuela, Arturo. A Nation of Enemies: Chile Under Pinochet. New York, W. W. Norton & Company, 1993.
- PALEY, Julia. Marketing Democracy: Power and Social Movements in Post-Dictatorship Chile. University of California Press, 2001
- SCHAEFER, Standard. Chile's Failed Economic Laboratory: an Interview with Michael Hudson. CounterPunch, October 20, 2003
- WINN, Peter (editor).Victims of the Chilean Miracle: Workers and Neoliberalism in the Pinochet Era, 1973-2002. Durham, NC: Duke University Press, 2004.
External links
- Economic Development in Chile at the Open Directory Project
- Chile; A Top Stock market Performer
- The Economic Transformation of Chile: A Model of Progress - HACER
- Invest in Chile
- World Reviews on Chile - this is Chile
Economy of Chile History Sectors Agriculture · Wine · Fishing and Aquaculture · Forestry · Energy · Mining · Tourism · Telecommunications · Central BankOther Chilean peso · Pension system · Ranked statistics by region · Infrastructure · Ministry of Finance · Ministry of Economy · Labour rights · Stock exchange Chile topics
History Timeline · First inhabitants · Captaincy General of Chile · Arauco War · Independence · Parliamentary Era (1891-1925) · Presidential Republic (1925–1973) · Presidency of Salvador Allende · 1973 coup · Pinochet regime · Transition to democracyLaw Constitution · Supreme Court · Civil Code · Law enforcement · Nationality law · Copyright law · Passport · Human rights · LGBT rightsPolitics Geography Regions · Provinces · Natural regions · Cities · Climate · Geology · Islands · Rivers · Extreme points · National ParksEconomy History · Peso · Central Bank · Stock Exchange · Companies · Agriculture · Communications · Transport · TourismMilitary Demographics Culture Other topics Healthcare · Education · Notable Chileans · International rankings · Holidays · Water supply and sanitation · Women · Beauty pageantsPortal · WikiProject Organisation for Economic Co-operation and Development (OECD) History Guidelines Members Australia · Austria · Belgium · Canada · Chile · Czech Republic · Denmark · Estonia · Finland · France · Germany · Greece · Hungary · Iceland · Ireland · Italy · Israel · Japan · Luxembourg · Mexico · Netherlands · New Zealand · Norway · Poland · Portugal · Slovakia · Slovenia · South Korea · Spain · Sweden · Switzerland · Turkey · United Kingdom · United States
Economy of South America Sovereign states Dependencies and
other territories- Aruba
- Bonaire
- Curaçao
- Falkland Islands
- French Guiana
- Categories:
- Economy of Chile
- Organisation for Economic Co-operation and Development member economies
- World Trade Organization member economies
Wikimedia Foundation. 2010.
Look at other dictionaries:
chile — /chil ee/, n. chili. * * * Chile Introduction Chile Background: A three year old Marxist government was overthrown in 1973 by a dictatorial military regime led by Augusto PINOCHET, who ruled until a freely elected president was installed in 1990 … Universalium
Chile — Chilean, adj., n. /chil ee/; Sp. /chee le/, n. a republic in SW South America, on the Pacific Coast. 14,508,168; 286,396 sq. mi. (741,765 sq. km). Cap.: Santiago. * * * Chile Introduction Chile Background: A three year old Marxist government was… … Universalium
Chile — For other uses, see Chile (disambiguation). Republic of Chile República de Chile (Spanish) … Wikipedia
Chile — <p></p> <p></p> Introduction ::Chile <p></p> Background: <p></p> Prior to the arrival of the Spanish in the 16th century, the Inca ruled northern Chile while the Mapuche inhabited central and… … The World Factbook
Chile pension system — The Pension System Spanish Sistema Previsional refers to old age, disability and survivor pensions for workers in Chile [http://www.reformaprevisional.cl/reforma previsional/archivos/descargas/Manual%20Informativo.pdf Reforma Previsional, Manual… … Wikipedia
Economy of Malaysia — Fixed exchange rates 1 Ringgit = 100 sen Fiscal year Calendar year … Wikipedia
Economy of Mexico — Going clockwise and starting from the upper left image: Port of Veracruz, Puerta de Hierro in Guadalajara Business District, Mastretta MXT automobile by Mexican automaker Mastretta, Pemex Oil platform in the … Wikipedia
Economy of New Zealand — Rank 60th Currency 1 New Zealand Dollar (NZD$) = 100 cents Fiscal year 1 April – 31 March Trade organisations APEC, WTO and OECD … Wikipedia
Economy of Denmark — National Bank (central bank) of Denmark. Rank 46 Currency Danish krone (DKK, kr) … Wikipedia
Economy of Colombia — Tourism in Riohacha, the capital of La Guajira Currency Colombian peso Fiscal year … Wikipedia
 18+© Academic, 2000-2024
- Contact us: Technical Support, Advertising
Dictionaries export, created on PHP, Joomla, Drupal, WordPress, MODx.