- Demographics of Mongolia
-
 Demographics of Mongolia, Data of FAO, year 2005 ; Number of inhabitants in thousands.
This article is about the demographic features of the population of Mongolia, including population density, ethnicity, education level, health of the populace, economic status, religious affiliations and other aspects of the population.
Mongolia's population growth rate is estimated at 1.54% (2000 census). About two-thirds of the total population is under age 30, 36% of whom are under 14.
Contents
Ethnicity and Languages
Nationality:
noun: Mongolian(s)
adjective: MongolianEthnic Mongols account for about 95% of the population and consist of Kalkh and other groups, all distinguished primarily by dialects of the Mongolian language. The Khalkhs make up 86% of the ethnic Mongol population. The remaining 14% include Oirats, Buryats and others. Ethnic distinctions among the Mongol subgroups are relatively minor. Language or tribal differences are not a political or social issue.
Significant Ethnic Turkic speaker Kazakhs constitute 3.9% of Mongolia's population and the other Tuvan, Khoton, Chantuu, Tsaatan are Mongolized people with Turkic origin and speak in Mongolian. Smaller numbers of Russian, Chinese, Korean and American people working in Mongolia, since 1990.
English is the most widely used foreign language followed by Russian. Lately, Japanese, Korean and German are gaining popularity.
Ethnic groups of Mongolia[1]
national censuses data, 1956-2010Ethnic groups 1956 1963 1969 1979 1989 2000 2007[2] 2010[3] Khalkh 639,141 775,376 911,079 1,235,806 1,610,424 1,934,674 2,134,493 2,168,141 Kazakh 36,729 47,735 62,812 84,305 120,506 102,983 140,152 101,526 Dörbet 25,667 31,339 34,725 45,053 55,208 66,706 70,252 72,403 Bayid 15,874 19,891 25,479 31,053 39,233 50,824 53,246 56,573 Buryat 24,625 28,523 29,772 29,802 35,444 40,620 44,211 45,087 Zakhchin 15,772 14,399 15,662 18,957 23,478 25,183 31,196 32,845 Dariganga 16,852 18,587 20,603 24,564 29,040 31,909 34,680 27,412 Uriankhai 10,833[4] 13,140 15,057 19,475 22,998 29,766 24,111 26,654 Darkhad ... 8,826 10,174 10,716 14,757 19,019 20,060 21,558 Khotogoid ... ... ... ... ... 7,237 ... 15,460 Torguud 4,729 6,028 7,119 8,617 10,050 12,628 12,950 14,176 Khoton 2,603 2,874 4,056 4,380 6,076 9,014 6,904 11,304 Myangad 2,518 2,712 3,222 4,173 4,760 6,028 8,222 6,592 Tuvan ... ... ... ... ... 4,778 ... 5,169 Barga 2,458 2,343 2,305 1,999 2,130 2,506 2,392 2,989 Üzemchin 2,046 2,070 2,127 2,030 2,086 2,386 1,995 2,577 Eljigin ... ... ... ... ... 151 ... 1,340 Sartuul ... ... ... ... ... 1,540 ... 1,286 Hamnigan ... ... ... ... ... 565 ... 537 Tsaatan ... ... ... ... ... 303 ... 282 Chantuu (Uzbeks) ... ... ... ... ... 380 ... 260 Kharchin ... ... ... ... ... 266 ... 152 Chahar ... ... ... ... ... 123 ... 132 Russian nationals 13,444 8,905 1,433 196 140 2,020 1,345 2,474 Chinese nationals 16,157 21,981 725 344 247 3,374 249 8,688 Korean nationals ... ... ... ... ... 338 ... 1,522 American nationals ... ... ... ... ... 303 ... 656 Others 11,125 6,819 35,045 8,653 1,509 ... 1,140 ... Mongolia 845,481 1,017,162 1,188,271 1,538,980 1,987,274 2,365,269 2,601,789 2,754,685 About 4.5 million Mongols live outside Mongolia; about 4 million live in China, mainly in the Inner Mongolia Autonomous Region, and some 500,000 live in Russia, primarily in Buryatia and Kalmykia.
Literacy:[5]
definition: age 15 and over can read and write
total population: 97.8%
male: 98%
female: 97.5%After a decline in enrollment ratios during the transition to a market economy in the 1990, school attendance is now once more near-universal: primary school attendance rate is estimated at 97%, and adult literacy at 98%[6].
Religions
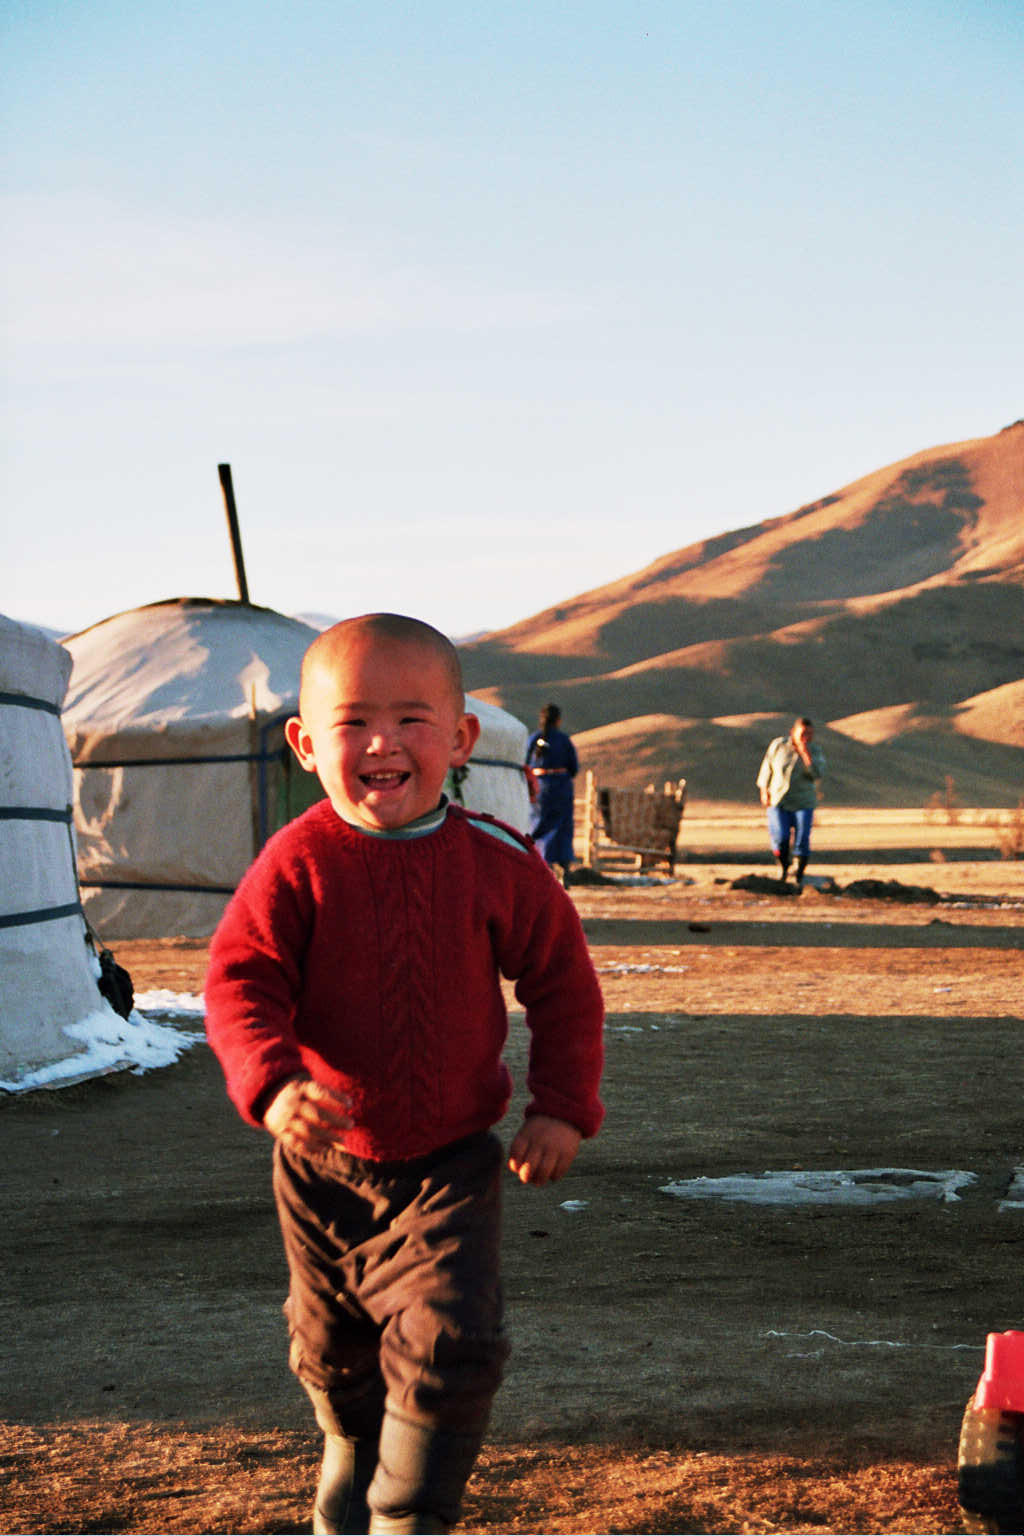
 A young Mongolian boy
Various forms of Tengriism and Shamanism have been widely practiced throughout the history of what is now modern day Mongolia, as such beliefs were common among nomadic people in Asian history. Such beliefs gradually gave way to Tibetan Buddhism, but shamanism has left a mark on Mongolian religious culture, and continues to be practiced. Traditionally, Tibetan Buddhism was the predominant religion. However, it was suppressed under the communist regime until 1990, with only one showcase monastery allowed to remain. Since 1990, as liberalization began, Buddhism has enjoyed a resurgence.
Religions in Mongolia
(population aged 15 and above)[7]Religion Population Share
%Buddhism 1,009,357 53.0 Islam 57,702 3.0 Shamanism 55,174 2.9 Christianity 41,117 2.1 Other religions 6,933 0.4 Atheism 735,283 38.6 TOTAL 1,905,566 100.0 Mongolian Urbanisation
Life in sparsely populated Mongolia has become more urbanized. Nearly half of the people live in the capital, Ulaanbaatar, and in other provincial centers. Semi nomadic life still predominates in the countryside, but settled agricultural communities are becoming more common. Mongolia's population growth rate is estimated at 1.54% (2000 census). About two-thirds of the total population is under age 30, 36% of whom are under 14.
Key: For population growth 1979 - 2008
- Salmon cells indicate that the population has declined or experienced minimal (<1%) growth.
- Light green cells indicate a growth between 1-2%.
- Dark Green cells indicate a growth of greater than or equal to 2%.
List of Mongolian CitiesRank Name Mongolian Inhabitants
(1979 est.[8][9][10])Inhabitants
(1989 est.[8][11])Inhabitants
(2000 census[8][12])Inhabitants
(est. 2008[8])Change since 1979 Growth Percentage/Year Administrative
Unit1. Ulan Bator * Улаанбаатар 396,300 540,600 711,900 1,008,738 612,438 +5.2% Ulan Bator 2. Erdenet Эрдэнэт 29,100 - 68,310 86,866 57,766 +6.6% Orkhon 3. Darkhan Дархан 49,100 - 65,791 74,300 25,200 +1.7% Darkhan-Uul 4. Choibalsan Чойбалсан 28,500 37,300 40,123 38,150 9,650 +1.1% Dornod 5. Mörön Мөрөн 16,500 21,300 28,903 36,082 19,582 +4.0% Khövsgöl 6. Nalaikh Налайх - - 23,600 29,115 5,515 +3.0% Ulan Bator 7. Khovd Ховд 17,500 24,100 25,765 28,601 11,101 +2.1% Khovd 8. Ölgii Өлгий 18,700 27,200 25,791 27,855 9,155 +1.6% Bayan-Ölgii 9. Bayankhongor Баянхонгор 16,300 21,200 22,066 26,252 9,952 +2.0% Bayankhongor 10. Baganuur Багануур - - 21,100 25,877 4,777 +1.8% Ulan Bator 11. Arvaikheer Багануур 12,300 16,900 19,058 25,622 13,322 +3.6% Övörkhangai 12. Ulaangom Улаангом 17,900 22,900 25,993 21,406 3,506 +0.67% Uvs 13. Sükhbaatar Сүхбаатар 14,300 19,600 22,374 19,626 5,326 +1.2% Selenge 14. Sainshand Сайншанд 11,100 10,300 18,290 25,210 14,110 +4.2% Dornogovi 15. Dalanzadgad Даланзадгад 10,000 14,300 14,050 16,856 6,856 +2.3% Ömnögovi 16. Tsetserleg Цэцэрлэг 14,700 20,300 18,519 16,300 1,600 +0.37% Arkhangai 17. Uliastai Улиастай 15,400 20,300 18,154 16,240 840 +0.17% Zavkhan 18. Altai Алтай 13,700 18,800 15,741 15,800 2,100 +0.5% Govi-Altai 19. Züünkharaa Зүүнхараа 11,400 - 15,000(2004) - 3,600 +1.1% Selenge 20. Öndörkhaan Өндөрхаан 11,100 14,400 18,003 14,800 3,700 +1.1% Khentii 21. Zuunmod Зуунмод 9,800 15,800 14,837 14,568 4,768 +1.6% Töv 22. Baruun-Urt Баруун-Урт 11,600 16,100 15,133 12,994 1,394 +0.4% Sükhbaatar 23. Zamyn-Üüd Замын-Үүд - - 5,486 11,527 6,041 +13.8% Dornogovi 24. Bulgan Булган 11,300 12,800 12,681 11,198 -102 -0.03% Bulgan 25. Mandalgovi Мандалговь 10,200 16,100 14,517 10,299 99 +0.03% Dundgovi 26. Kharkhorin Хархорин - - 8,977(2003) - - n/a% Övörkhangai 27. Bor-Öndör Бор-Өндөр - - 6,406(2001) 8,902 2,496 +3.5% Khentii 28. Choir Чойр 4,500 - 8,983 7,998 3,498 +2.6% Govisümber 29. Sharyngol Шарынгол - - 8,902 7,798 -1,104 -2.8% Darkhan-Uul Mongolia Монгол улс 1,538,980 1,987,274 2,365,269 2,635,000 1,096,600 +2.38% Darkhan-Uul * - city proper, Nalaikh, Baganuur, Bagakhangai not included in this figure, they are separated in the table.
From List of cities in Mongolia
Base Demographic Indicators for Mongolia
Base Demographic Indicators for Mongolia Demography indicator units U.S. Census Bureau
International
Data Base
1 July 2007[13]United Nations
World Population
Prospects:
The 2007 Revision
1 July 2007 [14]United Nations
Economic and Social
Commission for Asia
and Pacific(ESCAP)
1 July 2006 [15]National Statistical
Office of Mongolia
31 December 2007[16]Population person 2,951,786 2,629,000 2,605,000 2,635,200 Age structure: 0–14 years: % of total population 28.72 27 28 28.58 Age structure: 15–59 years: % of total population 65.56 67 n.a. 65.36 Age structure: 60 years and over: % of total population 5.72 6 n.a. 6.06 Population growth rate : % 1.486 1.20 0.9 1.545 Birth rate: births/1,000 population 21.07 18.5 19.7 (2000–2005) 21.7 Death rate: deaths/1,000 population 6.21 6.6 6.9 (2000–2005) 6.2 Net migration rate: migrant(s)/1,000 population 0 0 -4.0 (2000–2005) n.a. Sex ratio: at birth: male(s)/female 1.0500 1.01 1.0424 1.0310 Sex ratio: under 15 years: male(s)/female 1.0408 n.a. 1.0153 1.0193 Sex ratio: 15–59 years: male(s)/female 1.0003 n.a. 0.9414 0.9379 Sex ratio: 60 years and over: male(s)/female 0.8169 0.80 n.a. 0.7933 Sex ratio: total population: male(s)/female 1.0002 0.9947 n.a. 0.9508 Potential support ratio: persons aged 15 to 64
per persons aged 65 or older17.47 17 n.a. 16.33 Infant mortality rate: deaths/1,000 live births 42.65 40 39 (2005) 15.4 Mortality under age 5: deaths/1,000 n.a. 55 49 (2005) 22 Life expectancy at birth total population: years 66.99 68 65.1 (2000–2005) 66.54 Life expectancy at birth male: years 64.61 64 61.9 (2000–2005) 63.13 Life expectancy at birth female: years 69.48 70 68.4 (2000–2005) 70.23 Total fertility rate: children born/woman 2.2517 1.9 2.1 (2000–2005) 2.3 Age specific fertility rate: ages 15–19 (per 1,000) 22.5 45 49.7 (2000–2005) 18.7 Urban population: % of total population n.a. 57 56.8 60.75 Gross secondary school enrolment ratio males: % n.a. 84 n.a. 92.1 Gross secondary school enrolment ratio females: % n.a. 95 n.a. 95.6 Contraceptive prevalence rate all methods: % of women aged 15 to 49
who are married or in unionn.a. 67.4 n.a. n.a. Contraceptive prevalence rate modern methods: % of women aged 15 to 49
who are married or in unionn.a. 54.3 n.a. n.a. Persons with disabilities: % of total population n.a. 3.5 n.a. n.a. National poverty rate: % of total population n.a. 35.6 36.1 (2002) 32.2 Human development index: % of total population n.a. 0.691 n.a. 0.720 Population projected to 2025: person 3,725,352 3,112,000 n.a. n.a. Population projected to 2050: person 4,340,496 3,388,000 n.a. n.a. References
- ^ "Монгол улсын ястангуудын тоо, байршилд гарч буй өөрчлөлтyyдийн асуудалд" М.Баянтөр, Г.Нямдаваа, З.Баярмаа pp.57-70
- ^ State Center for Civil Registration and Information
- ^ Mongolia National Census 2010 Provision Results. National Statistical Office of Mongolia (in Mongolian.)
- ^ In the 1956 National Census Darkhad were counted with Uriankhai
- ^ CIA World Factbook, accessed Dec. 9th, 2008
- ^ For the 2000-2006 and 2000-2005 periods, respectively. UNICEF - At a glance: Mongolia, accessed June 15th, 2006
- ^ National Census 2010 Preliminary results (in Mongolian])
- ^ a b c d City Population - Historical population figures
- ^ Statistisches Bundesamt: Statistik des Auslands - Mongolei, 1985
- ^ Encyclopedia "Cartactual," published 01/01/85
- ^ http://www.nso.mn/eng/index.php National Statistical Office of Mongolia (accessed May, 2 2007)
- ^ (2000) PADCO: Mongolia Urban Development and Housing Sector Strategy, Final Report, Vol. 2, published 2005.
- ^ U.S. Census Bureau International Data Base - Mongolia Country Summary
- ^ United Nations World Population Prospects: The 2007 Revision
- ^ United Nations ESCAP 2007 Statistical Yearbook
- ^ Statistical Yearbook of Mongolia 2007, National Statistical Office, Ulaanbaatar, 2008
Ethnic groups in Asia Sovereign
states- Afghanistan
- Armenia
- Azerbaijan
- Bahrain
- Bangladesh
- Bhutan
- Brunei
- Burma (Myanmar)
- Cambodia
- People's Republic of China
- Cyprus
- East Timor (Timor-Leste)
- Egypt
- Georgia
- India
- Indonesia
- Iran
- Iraq
- Israel
- Japan
- Jordan
- Kazakhstan
- North Korea
- South Korea
- Kuwait
- Kyrgyzstan
- Laos
- Lebanon
- Malaysia
- Maldives
- Mongolia
- Nepal
- Oman
- Pakistan
- Philippines
- Qatar
- Russia
- Saudi Arabia
- Singapore
- Sri Lanka
- Syria
- Tajikistan
- Thailand
- Turkey
- Turkmenistan
- United Arab Emirates
- Uzbekistan
- Vietnam
- Yemen
States with limited
recognition- Abkhazia
- Nagorno-Karabakh
- Northern Cyprus
- Palestine
- Republic of China (Taiwan)
- South Ossetia
Dependencies and
other territories- Christmas Island
- Cocos (Keeling) Islands
- Hong Kong
- Macau
 Mongolia topics
Early History Xiongnu · Xianbei · Rouran · Khitan · Khamag Mongol · Mongol Empire (Pax Mongolica) · Yuan Dynasty · Northern Yuan · Mongolia during Qing rule

Modern History Politics Constitution · President · Prime Minister · State Great Khural · Supreme Court · Political parties · (Mongolian People's, Democratic) · Elections · Administrative divisions (Aimags, Sums, Cities) · Third neighbor policy
Economy History of 1921-1992 · Banking (Central, Khan, Golomt) · Currency · Mongolian Stock Exchange · Tourism · Agriculture · Transportation · Visa policy · Companies · International rankings
Geography Culture Naadam · Tsagaan Sar · Music (Morin khuur, Long song, Throat singing) · Dance · Sport · Mongolian wrestling · Literature · Cinema · Architecture · Goyol Fashion Festival
Society Demographics · Mongols (Khalkha, Oirats, Buryats) · Language · Writing systems · Religion (Buddhism, Islam, Christianity) · Media · Education · Cuisine · Medicine · Public Holidays · Women
See also Foreign relations · Human rights · LGBT rights · Military · Mongolian Nuclear-Weapons-Free Status
Categories:- Demographics by country
- Mongolian society


Wikimedia Foundation. 2010.