- Demographics of the Republic of Macedonia
-
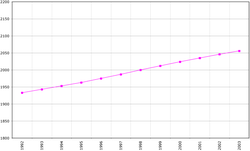 Demographics of the Republic of Macedonia, Data of FAO, year 2005 ; Number of inhabitants in thousands.
This article is about the demographic features of the population of Republic of Macedonia, including population density, ethnicity, education level, health of the populous, economic status, religious affiliations and other aspects of the population.
History of the
Republic of Macedonia
This article is part of a seriesChronological Ottoman Macedonia Karposh's Rebellion National awakening Ilinden Uprising Kruševo Republic Vardar Banovina National Liberation War Anti-Fascist Assembly (ASNOM) National Liberation Front Exodus from Northern Greece Socialist Republic of Macedonia 1963 Skopje earthquake Republic of Macedonia 2001 Insurgency in Macedonia Ohrid Agreement Topical Military history Demographics History of the Macedonian people Related Region of Macedonia Naming Dispute Public Holidays
Republic of Macedonia Portal
Contents
Total population
- 2,022,547 (2002 census)
- 2,038,514 (2006 est.[1] )
Vital statistics[1][2]
Average population (x 1000) Live births Deaths Natural change Crude birth rate (per 1000) Crude death rate (per 1000) Natural change (per 1000) 1947 1 134 40 000 17 400 22 600 35.3 15.3 19.9 1948 1 162 42 900 18 600 24 300 36.9 16.0 20.9 1949 1 192 46 400 18 900 27 500 38.9 15.9 23.1 1950 1 230 49 560 18 023 31 537 40.3 14.7 25.6 1951 1 267 45 329 20 747 24 582 35.8 16.4 19.4 1952 1 298 51 054 17 978 33 076 39.3 13.9 25.5 1953 1 322 49 665 19 312 30 353 37.6 14.6 23.0 1954 1 341 50 984 16 722 34 262 38.0 12.5 25.5 1955 1 354 49 093 17 919 31 174 36.3 13.2 23.0 1956 1 363 47 486 15 386 32 100 34.8 11.3 23.6 1957 1 370 46 107 17 341 28 766 33.7 12.7 21.0 1958 1 375 44 619 13 917 30 702 32.5 10.1 22.3 1959 1 382 44 638 14 998 29 640 32.3 10.9 21.4 1960 1 392 44 059 14 007 30 052 31.7 10.1 21.6 1961 1 405 42 182 13 141 29 041 30.0 9.4 20.7 1962 1 423 40 615 16 155 24 460 28.5 11.4 17.2 1963 1 442 41 284 13 229 28 055 28.6 9.2 19.5 1964 1 462 42 897 13 286 29 611 29.3 9.1 20.3 1965 1 481 42 433 12 758 29 675 28.7 8.6 20.0 1966 1 499 41 434 12 307 29 127 27.6 8.2 19.4 1967 1 516 40 763 12 523 28 240 26.9 8.3 18.6 1968 1 532 40 123 12 461 27 662 26.2 8.1 18.1 1969 1 550 40 342 13 112 27 230 26.0 8.5 17.6 1970 1 568 37 862 12 430 25 432 24.1 7.9 16.2 1971 1 587 37 904 12 447 25 457 23.9 7.8 16.0 1972 1 608 38 187 13 096 25 091 23.7 8.1 15.6 1973 1 629 37 478 12 217 25 261 23.0 7.5 15.5 1974 1 652 38 382 12 143 26 239 23.2 7.4 15.9 1975 1 676 39 579 12 629 26 950 23.6 7.5 16.1 1976 1 701 39 809 12 377 27 432 23.4 7.3 16.1 1977 1 728 38 932 12 899 26 033 22.5 7.5 15.1 1978 1 754 38 790 12 577 26 213 22.1 7.2 14.9 1979 1 777 39 407 12 653 26 754 22.2 7.1 15.1 1980 1 795 39 784 13 534 26 250 22.2 7.5 14.6 1981 1 806 39 488 13 378 26 110 21.9 7.4 14.5 1982 1 812 39 789 13 502 26 287 22.0 7.5 14.5 1983 1 816 39 210 14 391 24 819 21.6 7.9 13.7 1984 1 820 38 861 14 066 24 795 21.4 7.7 13.6 1985 1 828 38 722 14 408 24 314 21.2 7.9 13.3 1986 1 841 38 234 14 438 23 796 20.8 7.8 12.9 1987 1 857 38 572 14 644 23 928 20.8 7.9 12.9 1988 1 875 37 879 14 565 23 314 20.2 7.8 12.4 1989 1 893 35 927 14 592 21 335 19.0 7.7 11.3 1990 1 909 35 401 14 643 20 758 18.5 7.7 10.9 1991 1 923 34 830 14 789 20 041 18.1 7.7 10.4 1992 1 934 33 238 16 022 17 216 17.2 8.3 8.9 1993 1 944 32 374 15 591 16 783 16.7 8.0 8.6 1994 1 954 33 487 15 771 17 716 17.1 8.1 9.1 1995 1 963 32 154 16 338 15 816 16.4 8.3 8.1 1996 1 974 31 403 16 063 15 340 15.9 8.1 7.8 1997 1 984 29 478 16 596 12 882 14.9 8.4 6.5 1998 1 994 29 244 16 870 12 374 14.7 8.5 6.2 1999 2 004 27 309 16 789 10 520 13.6 8.4 5.2 2000 2 012 29 308 17 253 12 055 14.6 8.6 6.0 2001 2 018 27 010 16 919 10 091 13.4 8.4 5.0 2002 2 024 27 761 17 962 9 799 13.7 8.9 4.8 2003 2 028 27 011 18 006 9 005 13.3 8.9 4.4 2004 2 032 23 361 17 944 5 417 11.5 8.8 2.7 2005 2 037 22 482 18 406 4 076 11.0 9.0 2.0 2006 2 040 22 585 18 630 3 955 11.1 9.1 1.9 2007 2 044 22 688 19 594 3 094 11.1 9.6 1.5 2008 2 047 22 945 18 982 3 963 11.2 9.3 1.9 2009 2 051 23 684 19 060 4 624 11.5 9.3 2.3 2010 (p) 2 055 24 424 19 148 5 276 11.9 9.3 2.6 p=preliminary
Ethnic groups
The process of industrialization and urbanization after the WWII that caused the population growth to decrease involved the Macedonians to a greater extent than the Muslims. Rates of increase were very high among rural Muslims: Turks and Torbesh (Macedonian Muslims) are 2.5 times those of the Macedonian majority, while Albanians and Roma have 3 times as high. This has resulted in a significant demographic change as the Albanian population part has swelled from 17% after WWII to 25% in the 1990s. This has caused an increase in political tension and ultimately after a brief conflict forced the country to undertake reforms that decentralized the government. In 1994, Macedonian Slavs had a TFR of 2.07, while the TFR of others were - Albanian(4.10), Turkish(3.55), Roma(4.01), Serb(2.07), Vlax(1.88) and Others(3.05). The TFR by religions was - Christian (2.17,with 2.20 for Catholics and 2.06 for Orthodox), Islam (4.02) and others (2.16) [2].
-
Ethnic structure of Macedonia by settlements 1961.
-

Ethnic structure of Macedonia by settlements 1971.
-

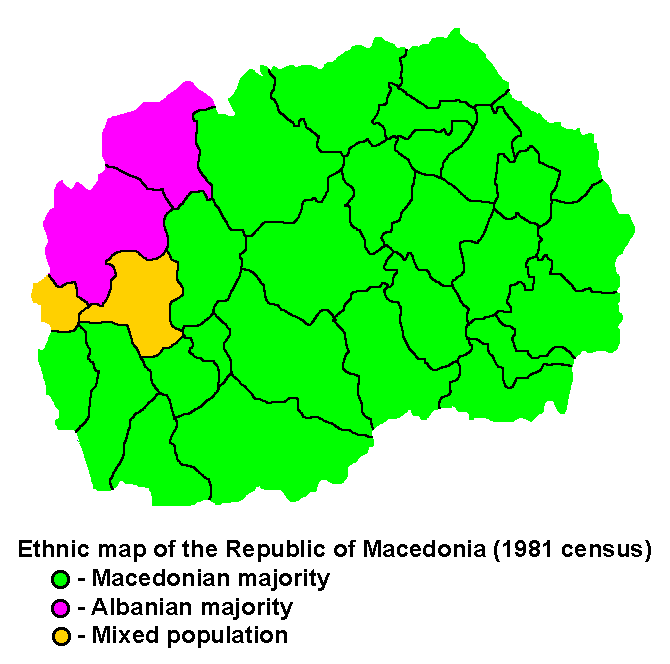
Ethnic structure of Macedonia by settlements 1981.
-

Ethnic map of the Republic of Macedonia, according to the 1981 census
-

Ethnic structure of Macedonia by settlements 1991.
-
Ethnic structure of Macedonia by settlements 1991.
-

Ethnic structure of Macedonia by settlements 1994.
-

Ethnic structure of Macedonia by settlements 2002.
-

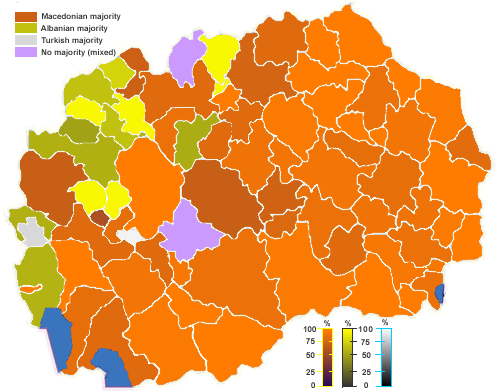
Ethnic groups in the Republic of Macedonia, according to the 2002 census
-

Ethnic groups in the Republic of Macedonia, according to the 2002 census
Population of Macedonia according to ethnic group 1948-2002[3] Ethnic
groupcensus 1948 census 1953 census 1961 census 1971 census 1981 census 1991 census 19941 census 2002 Number % Number % Number % Number % Number % Number % Number % Number % Macedonians 789,648 68.5 860,699 66.0 1,000,854 71.2 1,142,375 69.3 1,281,195 67.0 1,328,187 65.3 1,295,964 66.6 1,297,981 64.2 Albanians 197,3891 17.1 162,524 12.5 183,108 13.0 279,871 17.0 377,726 19.8 441,987 21.7 441,104 22.7 509,083 25.2 Turks 95,940 8.3 203,938 15.6 131,481 9.4 108,552 6.6 86,691 4.5 77,080 3.8 78,019 4.0 77,959 3.9 Romani 19,500 1.7 20,462 1.6 20,606 1.5 24,505 1.5 43,223 2.3 52,103 2.6 43,707 2.2 53,879 2.7 Serbs 29,721 2.6 35,112 2.7 42,728 3.0 46,465 2.8 44,613 2.3 42,775 2.1 40,228 2.1 35,939 1.8 Muslims 1,560 0.1 1,591 0.1 3,002 0.2 1,248 0.1 39,555 2.1 31,356 1.5 15,418 0.8 2,553 0.1 Bosniaks 6,829 0.3 17,018 0.8 Montenegrins 2,348 0.2 2,526 0.2 3,414 0.2 3,246 0.2 3,940 0.2 3,225 0.1 2,318 0.1 2,003 0.1 Croats 2,090 0.2 2,770 0.2 3,801 0.3 3,882 0.2 3,349 0.2 2,878 0.1 2,248 0.1 2.686 0.1 Yugoslavs 1,260 0.1 3,652 0.2 14,240 0.7 Vlachs 9,511 0.8 8,668 0.7 8,046 0.6 7,190 0.4 6,392 0.3 7,764 0.4 8,601 0.4 9,695 0.5 Bulgarians 889 0.1 920 0.1 3,087 0.2 3,334 0.2 1,984 0.1 1,370 0.1 1,682 0.1 1.417 0.1 Others or unspecified 4,390 0.4 5,304 0.4 4,616 0.3 22,988 1.4 6,228 0.3 45,239 2.2 9,814 0.5 14,8872 0.7 Total 1,152,986 1,304,514 1,406,003 1,647,308 1,909,136 2,033,964 1,945,932 2,022,547 1 Since 1994 residents who were permanently living abroad were no longer included 2 Ashkali: 3,713 or 0.184%, Greeks: 422 or 0.021%, Russians: 368 or 0.018%, Slovenes: 365 or 0.018%, Poles: 162 or 0.008%, Ukrainians: 136 or 0.007%, Germans: 88 or 0.004%, Czechs: 60 or 0.005%, Slovaks: 60 or 0.005%, Jews: 53 or 0.003%, Italians: 46 or 0.002%, Austrians: 35 or 0.002%, Rusyns: 24 or 0.001%, Regionally affiliated: 829 or 0.041%, Non-declared: 404 or 0.02%, Others: 5332 or 0.264%
Languages
- Macedonian: 1 344 815 - 66.5%
- Albanian: 507 989 - 25.1%
- Turkish: 71 757 - 3.5%
- Roma: 38 528 - 1.9%
- Serbian: 24 773 - 1.2%
- Bosnian: 8560 - 0.4%
- Aromanian: 6 884 - 0.3%
- other: 19 241 - 1.0%
-

Linguistic structureв of Macedonia by settlements 2002.
Religions
- Eastern Orthodox (Macedonian Orthodox ): 1,310,184 or 64.78%
- Muslim: 674,015 or 33.33%
- Catholics: 7,008 or 0.34%
- other: 31,340 or 1.55%
-

Religious structure of Macedonia by settlements 2002.
CIA World Factbook demographic statistics
The following demographic statistics are from the CIA World Factbook, unless otherwise indicated.
Age structure
- 0–14 years: 19.5% (male 210,078; female 203,106)
- 15–64 years: 67.8% (male 707,298; female 696,830)
- 65 years and over: 12.7% (male 97,437; female 124,661) (2004 est.)
Sex ratio
- at birth: 1.08 male(s)/female
- under 15 years: 1.08 male(s)/female
- 15–64 years: 1.02 male(s)/female
- 65 years and over: 0.78 male(s)/female
- total population: 1 male(s)/female (2004 est.)
Infant mortality rate
- total: 11.74 deaths/1,000 live births
- female: 10.73 deaths/1,000 live births (2004 est.)
- male: 12.67 deaths/1,000 live births
Life expectancy at birth
- total population: 74.73 years
- male: 72.45 years
- female: 77.2 years (2004 est.)
Total fertility rate
- 1.58 children born/woman (2011 est.)
HIV/AIDS
- adult prevalence rate: less than 0.1% (2001 est.)
- people living with HIV/AIDS: less than 100 (1999 est.)
- deaths: less than 100 (2001 est.)
Nationality
- noun: Macedonian
- adjective: Macedonian
See also
External links
References
- Statistical Yearbook of the Republic of Macedonia 2004 (CD version)
- ^ Institut national d'études démographique (INED)
- ^ State Statistical Office Republic of Macedonia
- ^ http://www.stat.gov.mk/PXWeb2007bazi/Database/Censuses/databasetree.asp Censuses of Population 1948-2002 State Statistical Office
Demographics of Europe Sovereign
states- Albania
- Andorra
- Armenia
- Austria
- Azerbaijan
- Belarus
- Belgium
- Bosnia and Herzegovina
- Bulgaria
- Croatia
- Cyprus
- Czech Republic
- Denmark
- Estonia
- Finland
- France
- Georgia
- Germany
- Greece
- Hungary
- Iceland
- Ireland
- Italy
- Kazakhstan
- Latvia
- Liechtenstein
- Lithuania
- Luxembourg
- Macedonia
- Malta
- Moldova
- Monaco
- Montenegro
- Netherlands
- Norway
- Poland
- Portugal
- Romania
- Russia
- San Marino
- Serbia
- Slovakia
- Slovenia
- Spain
- Sweden
- Switzerland
- Turkey
- Ukraine
- United Kingdom
- (England
- Northern Ireland
- Scotland
- Wales)
- Vatican City
States with limited
recognition- Abkhazia
- Kosovo
- Nagorno-Karabakh
- Northern Cyprus
- South Ossetia
- Transnistria
Dependencies
and other territories- Åland
- Faroe Islands
- Gibraltar
- Guernsey
- Jan Mayen
- Jersey
- Isle of Man
- Svalbard
Other entities - European Union
Categories:- Demographics by country
- Macedonian society


Wikimedia Foundation. 2010.