- Demographics of Norway
-
This article is about the demographic features of the population of Norway, including population density, ethnicity, education level, health of the populace, economic status, religious affiliations and other aspects of the population.
Contents
Total population
Historical populations Year Pop. ±% 1665 440,000 — 1769 723,618 +64.5% 1801 883,603 +22.1% 1825 1,051,318 +19.0% 1835 1,194,827 +13.7% 1855 1,490,047 +24.7% 1875 1,813,424 +21.7% 1900 2,240,032 +23.5% 1910 2,391,782 +6.8% 1920 2,649,775 +10.8% 1930 2,814,194 +6.2% 1946 3,156,950 +12.2% 1950 3,278,546 +3.9% 1955 3,408,161 +4.0% 1960 3,570,554 +4.8% 1965 3,708,609 +3.9% 1970 3,866,468 +4.3% 1975 3,997,525 +3.4% 1980 4,078,900 +2.0% 1985 4,145,845 +1.6% 1990 4,233,116 +2.1% 1995 4,348,410 +2.7% 2000 4,478,497 +3.0% 2060? 7,032,687 +57.0% Source: Statistics Norway [1] [2]. The total population of Norway on January 1st, 2011 was 4,920,305. Population growth in 2010 was 1.2%.
Population growth rate in 2010
- Norway:1.2%
- Northern Norway: 0.5%
- Trøndelag:0.9%
- Southern Norway:1.2%
- Eastern Norway:1.3%
- Western Norway:1.4%
Vital statistics
Births and deaths [1]
Average population (x 1000) Live births Deaths Natural change Crude birth rate (per 1000) Crude death rate (per 1000) Natural change (per 1000) 1900 2 231 66 229 35 345 30 884 29.7 15.8 13.8 1901 2 255 67 303 33 821 33 482 29.8 15.0 14.8 1902 2 276 66 494 31 670 34 824 29.2 13.9 15.3 1903 2 288 65 470 33 847 31 623 28.6 14.8 13.8 1904 2 298 64 143 32 895 31 248 27.9 14.3 13.6 1905 2 309 62 601 34 050 28 551 27.1 14.7 12.4 1906 2 319 62 091 31 668 30 423 26.8 13.7 13.1 1907 2 329 61 302 33 345 27 957 26.3 14.3 12.0 1908 2 346 61 686 33 366 28 320 26.3 14.2 12.1 1909 2 368 63 324 32 111 31 213 26.7 13.6 13.2 1910 2 384 61 486 32 207 29 279 25.8 13.5 12.3 1911 2 401 61 727 31 691 30 036 25.7 13.2 12.5 1912 2 423 61 409 32 663 28 746 25.3 13.5 11.9 1913 2 447 61 294 32 442 28 852 25.0 13.3 11.8 1914 2 472 62 111 33 280 28 831 25.1 13.5 11.7 1915 2 498 58 975 33 425 25 550 23.6 13.4 10.2 1916 2 522 61 120 34 910 26 210 24.2 13.8 10.4 1917 2 551 63 969 34 699 29 270 25.1 13.6 11.5 1918 2 578 63 468 44 218 19 250 24.6 17.2 7.5 1919 2 603 59 486 35 821 23 665 22.9 13.8 9.1 1920 2 635 69 326 33 634 35 692 26.3 12.8 13.5 1921 2 668 64 610 30 698 33 912 24.2 11.5 12.7 1922 2 695 62 908 32 484 30 424 23.3 12.1 11.3 1923 2 713 61 731 31 543 30 188 22.8 11.6 11.1 1924 2 729 58 021 30 850 27 171 21.3 11.3 10.0 1925 2 747 54 066 30 481 23 585 19.7 11.1 8.6 1926 2 763 54 163 29 933 24 230 19.6 10.8 8.8 1927 2 775 50 175 31 141 19 034 18.1 11.2 6.9 1928 2 785 49 881 30 301 19 580 17.9 10.9 7.0 1929 2 795 48 372 32 023 16 349 17.3 11.5 5.8 1930 2 807 47 844 29 616 18 228 17.0 10.5 6.5 1931 2 824 45 989 30 674 15 315 16.3 10.9 5.4 1932 2 842 45 451 30 102 15 349 16.0 10.6 5.4 1933 2 858 42 114 28 943 13 171 14.7 10.1 4.6 1934 2 874 41 833 28 340 13 493 14.6 9.9 4.7 1935 2 889 41 321 29 747 11 574 14.3 10.3 4.0 1936 2 904 42 240 30 100 12 140 14.5 10.4 4.2 1937 2 919 43 808 30 217 13 591 15.0 10.4 4.7 1938 2 936 45 319 29 211 16 108 15.4 9.9 5.5 1939 2 954 46 603 29 870 16 733 15.8 10.1 5.7 1940 2 973 47 943 32 045 15 898 16.1 10.8 5.3 1941 2 990 45 773 32 209 13 564 15.3 10.8 4.5 1942 3 009 53 225 32 062 21 163 17.7 10.7 7.0 1943 3 032 57 281 31 623 25 658 18.9 10.4 8.5 1944 3 060 62 241 32 652 29 589 20.3 10.7 9.7 1945 3 091 61 814 30 030 31 784 20.0 9.7 10.3 1946 3 127 70 727 29 220 41 507 22.6 9.3 13.3 1947 3 165 67 625 29 894 37 731 21.4 9.4 11.9 1948 3 201 65 618 28 375 37 243 20.5 8.9 11.6 1949 3 234 63 052 29 082 33 970 19.5 9.0 10.5 1950 3 265 62 410 29 699 32 711 19.1 9.1 10.0 1951 3 296 60 571 27 736 32 835 18.4 8.4 10.0 1952 3 328 62 543 28 417 34 126 18.8 8.5 10.3 1953 3 361 62 985 28 412 34 573 18.7 8.5 10.3 1954 3 394 62 739 29 158 33 581 18.5 8.6 9.9 1955 3 427 63 552 29 099 34 453 18.5 8.5 10.1 1956 3 460 64 171 29 981 34 190 18.5 8.7 9.9 1957 3 492 63 063 30 560 32 503 18.1 8.8 9.3 1958 3 523 62 985 31 645 31 340 17.9 9.0 8.9 1959 3 553 63 005 31 761 31 244 17.7 8.9 8.8 1960 3 581 61 880 32 543 29 337 17.3 9.1 8.2 1961 3 610 62 555 33 313 29 242 17.3 9.2 8.1 1962 3 639 62 254 34 318 27 936 17.1 9.4 7.7 1963 3 667 63 290 36 850 26 440 17.3 10.0 7.2 1964 3 694 65 570 35 171 30 399 17.8 9.5 8.2 1965 3 723 66 277 35 317 30 960 17.8 9.5 8.3 1966 3 753 67 061 36 010 31 051 17.9 9.6 8.3 1967 3 785 66 779 36 216 30 563 17.6 9.6 8.1 1968 3 819 67 350 37 668 29 682 17.6 9.9 7.8 1969 3 851 67 746 38 994 28 752 17.6 10.1 7.5 1970 3 877 64 551 38 723 25 828 16.6 10.0 6.7 1971 3 903 65 550 38 981 26 569 16.8 10.0 6.8 1972 3 933 64 260 39 375 24 885 16.3 10.0 6.3 1973 3 961 61 208 39 958 21 250 15.5 10.1 5.4 1974 3 985 59 603 39 464 20 139 15.0 9.9 5.1 1975 4 007 56 345 40 061 16 284 14.1 10.0 4.1 1976 4 026 53 474 40 216 13 258 13.3 10.0 3.3 1977 4 043 50 877 39 824 11 053 12.6 9.9 2.7 1978 4 059 51 749 40 682 11 067 12.7 10.0 2.7 1979 4 073 51 580 41 632 9 948 12.7 10.2 2.4 1980 4 086 51 039 41 340 9 699 12.5 10.1 2.4 1981 4 100 50 708 41 893 8 815 12.4 10.2 2.2 1982 4 115 51 245 41 454 9 791 12.5 10.1 2.4 1983 4 128 49 937 42 224 7 713 12.1 10.2 1.9 1984 4 140 50 274 42 528 7 746 12.1 10.3 1.9 1985 4 153 51 134 44 372 6 762 12.3 10.7 1.6 1986 4 167 52 514 43 560 8 954 12.6 10.5 2.1 1987 4 187 54 027 44 959 9 068 12.9 10.7 2.2 1988 4 209 57 526 45 354 12 172 13.7 10.8 2.9 1989 4 227 59 303 45 173 14 130 14.0 10.7 3.3 1990 4 241 60 939 46 021 14 918 14.4 10.9 3.5 1991 4 262 60 808 44 923 15 885 14.3 10.5 3.7 1992 4 286 60 109 44 731 15 378 14.0 10.4 3.6 1993 4 312 59 678 46 597 13 081 13.8 10.8 3.0 1994 4 325 59 200 44 076 15 124 13.7 10.2 3.5 1995 4 359 60 292 45 190 15 102 13.8 10.4 3.5 1996 4 381 60 927 43 860 17 067 13.9 10.0 3.9 1997 4 405 59 801 44 595 15 206 13.6 10.1 3.5 1998 4 431 58 130 44 045 14 085 13.1 9.9 3.2 1999 4 462 59 191 45 139 14 052 13.3 10.1 3.1 2000 4 491 59 229 44 225 15 004 13.2 9.8 3.3 2001 4 514 56 674 44 153 12 521 12.6 9.8 2.8 2002 4 538 55 445 44 711 10 734 12.2 9.9 2.4 2003 4 565 56 496 42 788 13 708 12.4 9.4 3.0 2004 4 592 56 959 41 635 15 324 12.4 9.1 3.3 2005 4 623 56 756 41 232 15 524 12.3 8.9 3.4 2006 4 661 58 545 41 068 17 477 12.6 8.8 3.7 2007 4 709 58 459 41 954 16 505 12.4 8.9 3.5 2008 4 768 60 497 41 712 18 785 12.7 8.7 3.9 2009 4 829 61 807 41 449 20 358 12.8 8.6 4.2 2010 4 889 61 442 41 500 19 942 12.6 8.5 4.1 2011 4 920 - - - - - - Total fertility rate
Norway has one of the highest fertility rates in Europe. Norwegian women had as many as 4.6 children in average in the late 19th century; more than ten children was not unusual. Later, it has decreased dramatically from 2.7 in the late 1960s to 1.6 in the early 1980s, however it has increased to almost 2.0 today.
1.98 children born/woman (2009)[2]
1.96 born/woman (2010 est)

1968-1969 1971-1975 1976-1980 1981-1985 1986-1990 1991-1995 1996-2000 2001-2005 2005 2006 2007 2008 2009 2.72 2.24 1.77 1.68 1.82 1.88 1.85 1.80 1.84 1.90 1.90 1.96 1.98 County Fertility rate Østfold 2.01 Akershus 1.99 Oslo 1.88 Hedmark 1.92 Oppland 1.87 Buskerud 1.91 Vestfold 1.84 Telemark 1.79 Aust-Agder 2.03 Vest-Agder 2.16 Rogaland 2.18 Hordaland 2.03 Sogn og Fjordane 2.10 Møre og Romsdal 2.13 Sør-Trøndelag 1.96 Nord-Trøndelag 2.12 Nordland 2.02 Troms 1.98 Finnmark 2.14 TFR for Norwegian residents by country of birth in 2004: Norway (1.8), Somalia (4.4), Iraq (4.3), Morocco (3.6), Pakistan (3.2), Turkey (2.3), Iran (1.6), Vietnam (2.0), Sri Lanka (2.7), India (1.8), and Bosnia and Herzegovina (1.7). [3]
Ethnicity

Ethnically, the residents of Norway are predominantly ethnic Norwegians who are of North Germanic / Nordic descent, although there are communities of the Scandanivian native people Sami who settled the area around 8,000 years ago, probably from continental Europe through the Norwegian coast and through Finland along the inland glaciers. The national minorities of Norway include Scandinavian Romani, Roma (“Gypsy”), Jews, and Kvener, as well as a small Finnish community.
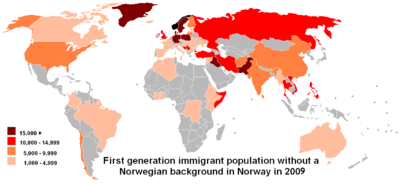
In recent years, Norway has become home to increasing numbers of immigrants, foreign workers, and asylum-seekers from various parts of the world (mostly from Europe and Asia). Norway had a steady influx of immigrants from Pakistan, East Asia (mainly the Chinese and Filipinos), Eastern Europe (i.e. Russians from Russia), Southern Europe (Greeks, Albanians from Kosovo, and former Yugoslavians), and Middle Eastern countries (Arabs, especially Iraqis and Palestinians), as well as Somalis, Turks, Moroccans, and some Latin Americans. After ten Eastern European and Baltic countries joined the EU in 2004, there has also been an influx of people from Poland, Estonia, Latvia and Lithuania.
See also: Immigration to NorwayCountry of origin Population (2011)[3]  Poland
60,610  Sweden
34,108  Pakistan
31,884  Iraq
Iraq27,827  Somalia
27,523  Germany
24,394  Vietnam
20,452  Denmark
19,522  Iran
Iran16,957  Turkey
16,430  Lithuania
16,309  Bosnia-Herzegovina
16,125  Russia
15,879 Immigration
Main article: Immigration to NorwayReligion
Main article: Religion in NorwayThe Lutheran Church of Norway is the state church and the vast majority remain at least nominal members. Other religions do, however, enjoy religious freedom and have prospered with immigration in recent years, particularly Islam and Roman Catholicism. Saint Olaf is the patron saint of Norway. He is regarded by some as the eternal king and has a reputation and place in history unchallenged by any other Norwegian King for the last 1000 years.
Official statistics (2010): Lutheran 80.6%, other Christian 3.6% (mainly Protestant [1.3%] and Roman Catholic) [1.3%]), Islam 2.0%, other religions (Buddhism 0.2%, Sikhism 0.0%, Hinduism 0.1%, and Judaism 0.0%), Human Ethical 1.7%, none and unknown 13.2%.
Religion Members Percent As of 2010[4] Christianity 4,093,358 84.2% Lutheranism 3,919,571 80.6% Catholicism 66,972 1.3% Pentecostalism 39,923 0.8% Jehovah's Witnesses 11,640 0.2% Methodism 11,082 0.2% Baptism 9,749 0.2% Orthodoxy 8,492 0.1% Seventh-day Adventist Church 5,136 0.1% Other Christianity 20,793 0.4% Non-Christian religions 121,321 2.4% Islam 98,953 2.0% Buddhism 13,376 0.2% Hinduism 5,175 0.1% Sikhism 1,037 0.02% Bahá'í Faith 1,012 0.02% Judaism 818 0.02% Other religions 950 0.02% Non-religious and unknown 643,520 13.2% Humanism 82,890 1.7% Total 4,858,199 100.0% Genetics
Y-chromosome DNA
Y-Chromosome DNA (Y-DNA) represents the male lineage, The Norwegian Y-chromosome pool may be summarized as follows where haplogroups R1 & I comprise generally more than 85% of the total chromosomes.[5]
- I ~ 55%
- R1 ~ 35%
- NOP ~ 5%
- Other Haplogroups ~ 5%
Mitochondrial DNA
Mitochondrial DNA mtDNA represents the female lineage, Haplogroup H represent about 40% of the Norwegian mitochondrial DNA lineages[6]
CIA World Factbook demographic statistics
The following demographic statistics are from the CIA World Factbook, unless otherwise indicated.
Population
4,960,700 (November 22, 2011)
1860: 1,583,525
1910: 2,376,952
1960: 3,570,554
2010: 4,858,199
2060?: 7,032,687Population - comparative
slightly larger than British Columbia, but slightly smaller than Singapore and Eritrea.
Age structure
(2011 est.)
0–14 years: 18.8% (male 472,060; female 449,649)
15–64 years: 66.2% (male 1,662,852; female 1,593,501)
65 years and over: 15.0% (male 325,937; female 416,306)Historical age structure
(1860 est.)
0–14 years: 35.9% (male 288,510; female 280,249)
15–64 years: 58.0% (male 446,391; female 472,405)
65 years and over: 6.1% (male 42,130; female 53,840)(1910 est.)
0–14 years: 35.0% (male 423,253; female 408,204)
15–64 years: 57.3% (male 640,835; female 722,443)
65 years and over: 7.7% (male 82,312; female 99,905)(1960 est.)
0–14 years: 26.0% (male 476,748; female 452,559)
15–64 years: 63.0% (male 1,125,525; female 1,123,206)
65 years and over: 11.0% (male 175,485; female 214,184)(2010 est.)
0–14 years: 18.9% (male 470,253; female 447,472)
15–64 years: 66.2% (male 1,641,821; female 1,575,980)
65 years and over: 14.9% (male 314,678; female 407,995)(2060 est.)
0–14 years: 17.4% (male 628,729; female 596,683)
15–64 years: 58.7% (male 2,114,792; female 2,016,030)
65 years and over: 23.9% (male 805,111; female 871,342)Median age
(2010 est.)
total: 39.7 years
male: 38.8 years
female: 40.5 yearsPopulation growth rate - comparative
Slightly higher than Arkansas and Samoa, but slightly lower than Liechtenstein and New Zealand.
Urbanization
(2011 est.)
urban population: 79.2% of total population (2005-10 est.)
rate of urbanization: 0.7% annual rate of changeSex ratio
(2004 est.)
at birth: 1.05 male(s)/female
under 15 years: 1.05 male(s)/female
15–64 years: 0.83 male(s)/female
65 years and over: 0.72 male(s)/female
total population: 0.98 male(s)/femaleInfant mortality rate
(2005)
total: 3.1 deaths/1,000 live births
male: 3.3 deaths/1,000 live births
female: 2.9 deaths/1,000 live birthsLife expectancy at birth
(2010)
total population: 81.04 years
male: 78.85 years
female: 83.15 yearsLanguage
Main article: Norwegian languageOfficial languages
Norwegian (the written standards Bokmål and Nynorsk).
Five Uralic languages – Finnish, South Sami, Lule Sami, North Sami and Kven – are additional official languages of some municipalities.Literacy
definition: age 15 and over can read and write
total population: 100%
male: NA%
female: NA%See also
References
- ^ Statistics Norway
- ^ Statistics Norway - Total fertility rate1, women, by county. 1968-2009
- ^ "Population 1 January 2009 and 2010 and changes in 2009, by immigration category and country background. Absolute figures". Statistics Norway. 2010. http://www.ssb.no/emner/02/01/10/innvbef/tab-2011-04-28-01.html.
- ^ Statistics Norway - Church of Norway and other religious and philosophical communities
- ^ Helgason et al. 2000, Zerjal et al. 2001, Passarino et al. 2002, Rootsi et al. 2004, Dupuy et al. 2006, Lindqvist et al. 2006
- ^ Passarino et al. 2002, Loogväli et al. 2004, Tambets et al. 2004, Lappalainen et al. 2006
 Norway topics
History Geography Law Politics Constitution · Counties · Elections · European Union relations · Foreign relations · Government · Monarchy · Municipalities · Political parties · Prime Minister (List) · Romantic nationalism · Sámi Parliament · ParliamentEconomy Norwegian krone · National Bank · Oslo Stock Exchange · Education · Energy · Media · Tourism · Transport · Companies · WhalingMilitary Symbols Demographics Administrative divisions · Cities · Postal codes · Languages · Religion · Immigration · Norwegians · List of NorwegiansCulture Architecture · Art · Cinema (Actors) · Music (Composers) · Cuisine · Norwegian language · Literature (Writers · Poets) · Bunad · Jul · Constitution Day · Media · Football · Rugby union · Public holidays
Demographics of Europe Sovereign
states- Albania
- Andorra
- Armenia
- Austria
- Azerbaijan
- Belarus
- Belgium
- Bosnia and Herzegovina
- Bulgaria
- Croatia
- Cyprus
- Czech Republic
- Denmark
- Estonia
- Finland
- France
- Georgia
- Germany
- Greece
- Hungary
- Iceland
- Ireland
- Italy
- Kazakhstan
- Latvia
- Liechtenstein
- Lithuania
- Luxembourg
- Macedonia
- Malta
- Moldova
- Monaco
- Montenegro
- Netherlands
- Norway
- Poland
- Portugal
- Romania
- Russia
- San Marino
- Serbia
- Slovakia
- Slovenia
- Spain
- Sweden
- Switzerland
- Turkey
- Ukraine
- United Kingdom
- (England
- Northern Ireland
- Scotland
- Wales)
- Vatican City
States with limited
recognition- Abkhazia
- Kosovo
- Nagorno-Karabakh
- Northern Cyprus
- South Ossetia
- Transnistria
Dependencies
and other territories- Åland
- Faroe Islands
- Gibraltar
- Guernsey
- Jan Mayen
- Jersey
- Isle of Man
- Svalbard
Other entities - European Union
Categories:

Wikimedia Foundation. 2010.