- Demographics of Belgium
-
Demographics of Kingdom of Belgium 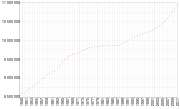
1948-2009Population: 10,755,000 (January 2009) Growth rate: 0.82% (2008) Birth rate: 11.7 births/1,000 population (2008) Death rate: 9.2 deaths/1,000 population (2008) Life expectancy: 79.22 years (2009 est.) –male: 76.06 years (2009 est.) –female: 82.53 years (2009 est.) Fertility rate: 1.65 children born/woman (2009 est.) Infant mortality rate: 4,62 Age structure: 0-14 years: 16.1% (male 857,373/female 822,303) 15-64 years: 66.3% (male 3,480,072/female 3,419,721) 65-over: 17.6% (male 760,390/female 1,074,477) (2009 est.) Sex ratio: At birth: 1.04 male(s)/female (2009 est.) Under 15: 1.04 male(s)/female 15-64 years: 1.02 male(s)/female 65-over: 0.72 male(s)/female Nationality: Nationality: noun: Belgian(s) adjective: Belgian Language: Spoken: Dutch, French, German This article is about the demographic features of the population of Belgium, including ethnicity, education level, health of the populace, economic status, religious affiliations and other aspects of the population. All figures are from the Nationaal Instituut voor Statistiek, unless otherwise indicated.[1]
Contents
Population
Belgium had a population of 10,839,905 people on January 1st, 2010, an increase of 601,000 in comparison to 2000 (10,239,085 inhabitants). Between 1990 (9,947,782 inhabitants) and 2000 the increase was only 291,000. The population of Flanders, Wallonia and Brussels on January 1st, 2010 was 6,251,983 (57.7%), 3,498,384 (32.3%) and 1,089,538 (10.1%), respectively.
Immigration
In 2007, there were 1.38 million foreign-born residents in Belgium, corresponding to 12.9% of the total population. Of these, 685 000 (6.4%) were born outside the EU and 695 000 (6.5%) were born in another EU Member State[2].
Vital statistics
Births and deaths
Note: Territorial changes in East-Belgium occurred in 1925, 1940 and 1944.
Average population (x 1,000) Live births Deaths Natural change Crude birth rate (per 1,000) Crude death rate (per 1,000) Natural change (per 1,000) 1900 6,719 193,789 129,046 64,743 28.8 19.2 9.6 1901 6,747 200,077 116,077 84,000 29.7 17.2 12.4 1902 6,848 195,871 119,330 76,541 28.6 17.4 11.2 1903 6,941 192,301 118,675 73,626 27.7 17.1 10.6 1904 7,030 191,721 119,506 72,215 27.3 17.0 10.3 1905 7,118 187,437 118,343 69,094 26.3 16.6 9.7 1906 7,200 186,271 118,884 67,387 25.9 16.5 9.4 1907 7,278 185,138 115,347 69,791 25.4 15.8 9.6 1908 7,352 183,834 121,964 61,870 25.0 16.6 8.4 1909 7,419 176,431 117,571 58,860 23.8 15.8 7.9 1910 7,438 176,413 112,826 63,587 23.7 15.2 8.5 1911 7,457 171,802 122,843 48,959 23.0 16.5 6.6 1912 7,531 171,187 112,378 58,809 22.7 14.9 7.8 1913 7,605 171,099 111,227 59,872 22.5 14.6 7.9 1914 7,662 156,389 108,720 47,669 20.4 14.2 6.2 1915 7,697 124,291 100,674 23,617 16.1 13.1 3.1 1916 7,701 99,360 101,044 -1,684 12.9 13.1 -0.2 1917 7,667 86,675 124,824 -38,149 11.3 16.3 -5.0 1918 7,599 85,056 157,340 -72,284 11.2 20.7 -9.5 1919 7,566 123,314 113,732 9,582 16.3 15.0 1.3 1920 7,491 164,950 102,505 62,445 22.0 13.7 8.3 1921 7,444 164,603 102,908 61,695 22.1 13.8 8.3 1922 7,511 154,871 106,615 48,256 20.6 14.2 6.4 1923 7,573 156,600 100,084 56,516 20.7 13.2 7.5 1924 7,646 154,083 99,653 54,430 20.2 13.0 7.1 1925 7,748 155,330 99,569 55,761 20.0 12.9 7.2 1926 7,843 151,009 101,018 49,991 19.3 12.9 6.4 1927 7,903 146,296 103,007 43,289 18.5 13.0 5.5 1928 7,968 148,071 102,270 45,801 18.6 12.8 5.7 1929 8,032 147,311 115,901 31,410 18.3 14.4 3.9 1930 8,076 152,530 103,397 49,133 18.9 12.8 6.1 1931 8,126 149,657 103,773 45,884 18.4 12.8 5.6 1932 8,186 145,835 104,221 41,614 17.8 12.7 5.1 1933 8,231 136,757 104,640 32,117 16.6 12.7 3.9 1934 8,262 133,514 96,851 36,663 16.2 11.7 4.4 1935 8,288 128,432 102,132 26,300 15.5 12.3 3.2 1936 8,315 127,751 101,595 26,156 15.4 12.2 3.1 1937 8,346 128,696 104,163 24,533 15.4 12.5 2.9 1938 8,374 133,610 104,684 28,926 16.0 12.5 3.5 1939 8,391 130,019 110,393 19,626 15.5 13.2 2.3 1940 8,301 112,497 125,083 -12,586 13.6 15.1 -1.5 1941 8,276 100,616 118,670 -18,054 12.2 14.3 -2.2 1942 8,246 108,603 117,291 -8,688 13.2 14.2 -1.1 1943 8,241 123,349 107,767 15,582 15.0 13.1 1.9 1944 8,291 127,122 124,861 2,261 15.3 15.1 0.3 1945 8,339 130,526 121,155 9,371 15.7 14.5 1.1 1946 8,367 152,962 110,413 42,549 18.3 13.2 5.1 1947 8,450 150,227 108,136 42,091 17.8 12.8 5.0 1948 8,557 150,416 108,016 42,400 17.6 12.6 5.0 1949 8,614 147,854 111,104 36,750 17.2 12.9 4.3 1950 8,639 145,672 108,236 37,436 16.9 12.5 4.3 1951 8,678 142,314 109,763 32,551 16.4 12.6 3.8 1952 8,730 146,064 104,178 41,886 16.7 11.9 4.8 1953 8,778 146,125 105,863 40,262 16.6 12.1 4.6 1954 8,819 148,538 105,033 43,505 16.8 11.9 4.9 1955 8,868 149,195 108,743 40,452 16.8 12.3 4.6 1956 8,924 150,210 108,761 41,449 16.8 12.2 4.6 1957 8,989 152,871 107,840 45,031 17.0 12.0 5.0 1958 9,053 155,048 106,051 48,997 17.1 11.7 5.4 1959 9,104 158,237 103,933 54,304 17.4 11.4 6.0 1960 9,153 154,787 113,938 40,849 16.9 12.4 4.5 1961 9,184 158,431 106,985 51,446 17.3 11.6 5.6 1962 9,251 155,061 112,758 42,303 16.8 12.2 4.6 1963 9,328 159,192 116,718 42,474 17.1 12.5 4.6 1964 9,428 160,838 110,100 50,738 17.1 11.7 5.4 1965 9,499 155,496 115,045 40,451 16.4 12.1 4.3 1966 9,528 151,096 115,613 35,483 15.9 12.1 3.7 1967 9,581 146,193 115,212 30,981 15.3 12.0 3.2 1968 9,619 141,984 121,744 20,240 14.8 12.7 2.1 1969 9,660 141,799 120,471 21,328 14.7 12.5 2.2 1970 9,656 142,168 118,660 23,508 14.7 12.3 2.4 1971 9,695 140,966 118,853 22,113 14.5 12.3 2.3 1972 9,711 136,304 117,424 18,880 14.0 12.1 1.9 1973 9,742 129,424 118,254 11,170 13.3 12.1 1.1 1974 9,772 123,674 116,159 7,515 12.7 11.9 0.8 1975 9,801 119,693 119,425 268 12.2 12.2 0.0 1976 9,818 121,034 118,641 2,393 12.3 12.1 0.2 1977 9,830 121,852 112,672 9,180 12.4 11.5 0.9 1978 9,840 122,592 115,388 7,204 12.5 11.7 0.7 1979 9,848 123,825 112,010 11,815 12.6 11.4 1.2 1980 9,849 124,398 113,699 10,699 12.6 11.5 1.1 1981 9,859 123,792 112,326 11,466 12.6 11.4 1.2 1982 9,856 120,231 111,871 8,360 12.2 11.4 0.8 1983 9,856 117,145 114,534 2,611 11.9 11.6 0.3 1984 9,855 115,715 109,658 6,057 11.7 11.1 0.6 1985 9,858 114,030 110,770 3,260 11.6 11.2 0.3 1986 9,862 117,102 111,343 5,759 11.9 11.3 0.6 1987 9,870 117,334 105,426 11,908 11.9 10.7 1.2 1988 9,902 119,456 104,552 14,904 12.1 10.6 1.5 1989 9,938 121,117 107,619 13,498 12.2 10.8 1.4 1990 9,967 123,726 104,818 18,908 12.4 10.5 1.9 1991 10,004 126,068 105,150 20,918 12.6 10.5 2.1 1992 10,045 124,774 104,200 20,574 12.4 10.4 2.0 1993 10,084 120,998 108,170 12,828 12.0 10.7 1.3 1994 10,116 116,449 104,894 11,555 11.5 10.4 1.1 1995 10,137 115,638 105,933 9,705 11.4 10.5 1.0 1996 10,157 115,214 104,140 11,074 11.3 10.3 1.1 1997 10,181 115,864 103,802 12,062 11.4 10.2 1.2 1998 10,203 114,276 104,583 9,693 11.2 10.3 1.0 1999 10,226 113,469 104,904 8,565 11.1 10.3 0.8 2000 10,251 114,883 104,903 9,980 11.2 10.2 1.0 2001 10,278 114,172 103,447 10,725 11.1 10.1 1.0 2002 10,333 111,225 105,642 5,583 10.8 10.2 0.5 2003 10,376 112,149 107,039 5,110 10.8 10.3 0.5 2004 10,421 115,618 101,946 13,672 11.1 9.8 1.3 2005 10,479 118,002 103,278 14,724 11.3 9.9 1.4 2006 10,548 121,382 101,587 19,795 11.5 9.6 1.9 2007 10,626 120,663 100,658 20,005 11.4 9.5 1.9 2008 10,710 128,049 104,587 23,462 12.0 9.8 2.2 2009 10,796 127,297 104,509 22,788 11.8 9.7 2.1 Infant mortality rate
4.8 in 2010
3.4 in 2011Total Fertility Rate
The total fertility rate (TFR) gradually increased during the last decade from 1.60 in 1997, 1.65 in 2002 and 1.82 in 2007. The rates in Brussels are higher than the national average (1.79 in 1997, 1.93 in 2002 and 2.09 in 2007), while they are below the average in Flanders (1.54 in 1997, 1.56 in 2002 and 1.77 in 2007).[1]
Life expectancy
Male: 74.4 in 1999, 77.2 in 2009
Female: 80.9 in 1999, 82.4 in 2009
Total: 77.7 in 1999, 79.8 in 2009Ethnic groups
The country is populated by a Flemish majority of about 6,000,000 people speaking Dutch, a Walloon minority of 3,400,000 people speaking French, and about 73,000 German speaking people in Wallonia, near the German border. However, David Levinson reports that "the Flemish and Walloon groups are described by experts as "communities" rather than as ethnic groups, and individuals can move easily from one community to the other by learning to speak the other language".[3]
The rest consists mostly of French-speaking people from Brussels, Italians, Dutch, French, Moroccans, Algerians, Turks, Congolese, Poles, and Indians. (Around 23% of Belgium's population is of non-Belgian origin)[4]
The exact number of French-speakers in Brussels is hard to determine, but it is estimated that 77% of the people living in Brussels use French and 16% use Dutch in their households, as the sole language or secondary language. See the Brussels article for more details.
Languages
Main article: Languages of BelgiumBelgium's three official languages are Dutch, spoken by 60% of the population, French, spoken by 39%, and German, spoken by less than 1%. The vast majority of Belgium's population, 99%, is literate as defined by the Belgian government, i.e. capable of reading and writing in an official language by the time a citizen has reached the age of 15.
Religion
Main article: Religion in BelgiumMost, 75% of Belgians, are nominally Roman Catholic. Protestant, Muslim, agnostic, atheist and other minority religions comprise 25% of the population.
CIA World Factbook demographic statistics
The following demographic statistics are from the CIA World Factbook, unless otherwise indicated.
Age structure
0–14 years: 16.1% (male 857,373/female 822,303)
15–64 years: 66.3% (male 3,480,072/female 3,419,721)
65 years and over: 17.6% (male 760,390/female 1,047,477) (2009 est.)Sex ratio
At birth: 1.04 male(s)/female
Under 15 years: 1.04 male(s)/female
15–64 years: 1.02 male(s)/female
65 years and over: 0.71 male(s)/female
Total population: 0.96 male(s)/female (2009 est.) Population pyramid of Belgium
Literacy
Definition: age 15 and over can read and write (2003 est.)
Total population: 99%
Male: 99%
Female: 99%Education expenditures
6% of total GDP (2004)
- country comparison to the world: 40
Nationality
noun: Belgian(s)
adjective: BelgianReferences
 This article incorporates public domain material from the CIA World Factbook document "2008 edition".
- ^ Nationaal Instituut voor Statistiek
- ^ L'IMMIGRATION EN BELGIQUE. EFFECTIFS, MOUVEMENTS. ET MARCHE DU TRAVAIL. Rapport 2009. Direction générale Emploi et marché du travai
- ^ Levinson, David (1998). Ethnic Groups Worldwide: A Ready Reference Handbook. Phoenix, AZ: Oryx Press. p. 14. ISBN 1573560197. http://books.google.co.uk/books?id=uwi-rv3VV6cC&pg=PA14#v=onepage&q&f=false.
- ^ http://www.npdata.be/BuG/125-Vreemde-afkomst/
See also
Demographics of Europe Sovereign
states- Albania
- Andorra
- Armenia
- Austria
- Azerbaijan
- Belarus
- Belgium
- Bosnia and Herzegovina
- Bulgaria
- Croatia
- Cyprus
- Czech Republic
- Denmark
- Estonia
- Finland
- France
- Georgia
- Germany
- Greece
- Hungary
- Iceland
- Ireland
- Italy
- Kazakhstan
- Latvia
- Liechtenstein
- Lithuania
- Luxembourg
- Macedonia
- Malta
- Moldova
- Monaco
- Montenegro
- Netherlands
- Norway
- Poland
- Portugal
- Romania
- Russia
- San Marino
- Serbia
- Slovakia
- Slovenia
- Spain
- Sweden
- Switzerland
- Turkey
- Ukraine
- United Kingdom
- (England
- Northern Ireland
- Scotland
- Wales)
- Vatican City
States with limited
recognition- Abkhazia
- Kosovo
- Nagorno-Karabakh
- Northern Cyprus
- South Ossetia
- Transnistria
Dependencies
and other territories- Åland
- Faroe Islands
- Gibraltar
- Guernsey
- Jan Mayen
- Jersey
- Isle of Man
- Svalbard
Other entities - European Union
Categories:- Demographics of Belgium
- Belgian society


Wikimedia Foundation. 2010.