- Demographics of Brazil
-
Brazil's population is very diverse, comprising many races and ethnic groups. In general, Brazilians trace their origins from four sources: Amerindians, Europeans, Africans and Asians.
Brazil has conducted a periodical population census since 1872. Since 1940, this census has been carried out decennially. Scanned versions of the forms for each census distributed in Brazil since 1960 are available on-line from IPUMS International.[1]
Historically, Brazil has experienced large degrees of ethnic and racial miscegenation, assimilation of cultures and syncretism.
Contents
Largest cities
Main articles: List of largest cities in Brazil and Largest Cities of Northeast Region, BrazilLargest cities of Brazil
2010 Brazilian Institute of Geography and Statistics estimate[2]Rank City Name State Pop. Rank City Name State Pop. 
São Paulo
1 São Paulo São Paulo 11,316,149 11 Belém Pará 1,402,056 
Salvador
2 Rio de Janeiro Rio de Janeiro 6,355,949 12 Goiânia Goiás 1,318,148 3 Salvador Bahia 2,693,605 13 Guarulhos São Paulo 1,233,426 4 Brasília Federal District 2,609,997 14 Campinas São Paulo 1,088,611 5 Fortaleza Ceará 2,476,589 15 São Luís Maranhão 1,027,429 6 Belo Horizonte Minas Gerais 2,385,639 16 São Gonçalo Rio de Janeiro 1,008,064 7 Manaus Amazonas 1,832,423 17 Maceió Alagoas 943,109 8 Curitiba Paraná 1,764,540 18 Duque de Caxias Rio de Janeiro 861,157 9 Recife Pernambuco 1,546,516 19 Teresina Piauí 822,363 10 Porto Alegre Rio Grande do Sul 1,413,094 20 Natal Rio Grande do Norte 810,780 Cities in Brazil, except for the state of São Paulo, are usually not arranged in a single network, but rather on various export paths to seaside ports. The most important cities are on the coast or close to it. State capitals are also each the largest city in its state, except for Vitória, Brazil, the capital of Espírito Santo, and Florianópolis, the capital of Santa Catarina. There are also non-capital metropolitan areas in São Paulo state (Campinas, Santos and Paraíba Valley), Minas Gerais (Steel Valley), Rio Grande do Sul (Sinos Valley), and Santa Catarina (Itajaí Valley).
São Paulo and Rio de Janeiro are far larger than any other Brazilian city. São Paulo's influence in most economic aspects can be noted in a national (and even international) scale; other Brazilian metropolises are second tier, even though Rio de Janeiro (partially due to its former status as the national capital) still host various large corporations' headquarters, besides being Brazil's cultural center with respect to soap operas and film production.
Migrations
Immigration
Main article: Immigration to BrazilImmigration to Brazil, by national origin, periods from 1830 to 1933
Source: Brazilian Institute for Geography and Statistics (IBGE)Period origin 1830–1855 1856–1883 1884–2053 1894–1903 1904–1913 1914–1923 1924–1933 Portuguese 16,737 116,000 170,621 155,542 384,672 201,252 233,650 Italians — 100,000 510,533 537,784 196,521 86,320 70,177 Spaniards — — 113,116 102,142 224,672 94,779 52,400 Germans 2,008 30,000 22,778 6,698 33,859 29,339 61,723 Japanese — — — — 11,868 20,398 110,191 Syrians and Lebanese — — 96 7,124 45,803 20,400 20,400 Others — — 66,524 42,820 109,222 51,493 164,586 Immigration has been a very important demographic factor in the formation, structure and history of the population in Brazil, influencing culture, economy, education, racial issues, etc. Brazil has received the third largest number of immigrants in the Western Hemisphere, after the United States and Argentina.
Brazil's structure, legislation and settlement policies for arriving immigrants were much less organized than in Canada and the United States at the time. Nevertheless, an Immigrant's Hostel (Hospedaria dos Imigrantes) was built in 1886 in São Paulo, and quick admittance and recording routines for the throngs of immigrants arriving by ship at the seaports of Vitória, Rio de Janeiro, Santos, Paranaguá, Florianópolis and Porto Alegre were established. The São Paulo State alone processed more than 2.5 million immigrants in its almost 100 years of continuous operation. People of more than 70 different nationalities were recorded.
Following the trend of several other countries in the Americas, which encouraged immigration from many countries, Brazil quickly became a melting pot of races and nationalities, but being peculiar in the sense of having the highest degree of intermarriage in the world. Immigrants found a strong social and cultural tolerance toward inter-racial marriage, including large numbers of Mulattoes (white and black), Caboclos (Indian and White) and mixed European, African and Indian people, though it was not accompanied by an entire lack of racism. Correspondingly, the same mentality reflected in low psychological and social barriers regarding intermarriage between Europeans, Middle Easterners and Asians of several origins, as well as between people of different religions.
History of immigration
It is believed that the Americas were settled by three migratory waves from Northern Asia. The Native Brazilians are thought to descend from the first wave of migrants, who arrived in the region around 9000 BC. The main Native Brazilian groups are the Tupi-Guarani, the Jê, the Arawaks and the Caraibas (Caribs). The Tupi-Guarani nation, originally from the Paraná river basin and also the main of Native-Paraguayan nations, had spread all along the Brazilian coastline from South to North and got to be known by the Portuguese as "Os Índios da Língua Geral" ("The Indians of the General Language"); the Jê nation occupied most of the interior of the country from Maranhão to Santa Catarina. The Arawaks and the Caribs, the last ones to get in contact with the Portuguese, lived in the North and Northwest of Brazil.
The European immigration to Brazil started in the 16th century, with the vast majority of them coming from Portugal. In the first two centuries of colonization, 100,000 Portuguese arrived in Brazil (around 500 colonists per year). In the 18th century, 600,000 Portuguese arrived (6,000 per year).[3] The first region to be settled by the Portuguese was Northeastern Brazil, followed by the Southeast region. The original Amerindian population of Brazil (between two and five million) has in large part been exterminated or assimilated into the Portuguese population.[4] The Mamelucos (or Caboclos, a mixed race between Whites and Amerindians) have always been present in many parts of Brazil.
Another important ethnic group, Africans, first arrived as slaves. Many came from Guinea, or from West African countries - by the end of the eighteenth century many had been taken from the Kingdom of Kongo and modern-day Angola, Mozambique and Nigeria. By the time of the end of the slave trade in 1850, around three to five million slaves had been brought to Brazil–37% of all slave traffic between Africa and the Americas. Nowadays, there are still small immigration waves coming from the African continent.
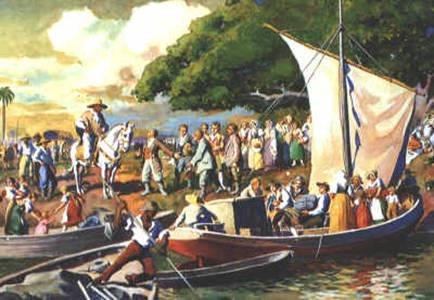
 A painting showing the arrival of the first German immigrants to Southern Brazil.
The largest influx of European immigrants to Brazil occurred in the late 19th and early 20th centuries. According to the Memorial do Imigrante statistics data, Brazil attracted nearly 5 million immigrants between 1870 and 1953.[5][6] These immigrants were divided in two groups: a part of them was sent to Southern Brazil to work as small farmers. However, the biggest part of the immigrants was sent to Southeast Brazil to work in the coffee plantations. The immigrants sent to Southern Brazil were mainly Germans (starting in 1824, mainly from Rhineland-Palatinate, Pomerania, Hamburg, Westphalia, etc.) and Italians (starting in 1875, mainly from the Veneto and Lombardia). In the South, the immigrants established rural communities that, still today, have a strong cultural connection with their ancestral homelands. In south east Brazil, most of the immigrants were Italians (mainly from the Veneto, Campania, Calabria and Lombardia), Portuguese (mainly from Beira Alta, Minho and Alto Trás-os-Montes), Spaniards (mainly from Galicia and Andalusia).
Notably, the first half of the 20th century saw a large inflow of Japanese (mainly from Honshū, Hokkaidō and Okinawa) and Arab (from Lebanon and Syria) immigrants. These Arab immigrants were—and still are—wrongly called "Turks" by many Brazilians because their original countries were still under Turkish rule back in the day Arab immigration to Brazil began. The number of actual Turks who immigrated to Brazil was in fact very small.
IBGE's 1998 PME
In 1998, the IBGE, within its preparation for the 2000 Census, experimentally introduced a question about "origem" (ancestry) in its "Pesquisa Mensal de Emprego" (Monthly Employment Research), in order to test the viability of introducing that variable in the Census.[7] This research interviewed about 90,000 people in six metropolitan regions (São Paulo, Rio de Janeiro, Porto Alegre, Belo Horizonte, Salvador, and Recife).[8]
Here are its results for both the White population and the population in general:[9]:
Brazilian Population, by ancestry, 1998[10] Ancestry % of Whites % of all races Brazilian 83.11% 86.09% Italian 15.72% 10.41% Portuguese 14.50% 10.46% Spanish 6.42% 4.40% German 5.51% 3.54% Indigenous 4.80% 6.64% Black 1.30% 5.09% Arab 0.72% 0.48% Japanese 0.62% 1.34% African 0.58% 2.06% Jewish 0.25% 0.20% Others 4.05% 2.81% Total 137.58% 133.52% Notice that the total is higher than 100% because of multiple claims of ascendants from different nations in the answers.
Emigration
In the second half of the 1980s, Brazilians from various socioeconomic levels started to emigrate to other countries in search of economic opportunities. High inflation and low economic growth in the 1980s, signs of what became known as the "lost decade" in Latin America, followed by the government's unsuccessful liberal economic policies in the 1990s, meant that even educated Brazilians could make more money doing low-skilled work abroad.
In the 1990s, nearly 1.9 million Brazilians were living outside the country, mainly in the United States, Paraguay and Japan,[11] but also in Italy, Portugal, the United Kingdom, France, Canada, Australia, Switzerland, Germany, Belgium, Spain and Israel. However, there were no specific policies implemented by the government to encourage or discourage this emigration process.[12]
The 2000 Brazilian Census provides some information about the high number of migrants returning to Brazil. Of those who reported residing in another country less than 10 years before the 2000 census, 66.9 percent were Brazilians. If only the returning migrants (former Brazilian immigrants) are considered, 26.8 percent of Brazilians came from Paraguay, 17 percent came from Japan, and 15.8 percent came from the United States.[12]
Racial composition
Main article: Race in BrazilMost of the population descends from early European settlers—chiefly Portuguese, including Portuguese New Christians, descendants of Jews forced to convert to Christianity;[13] African (Yoruba, Ewe, Akan, Bantu, and others), and assimilated indigenous peoples (mostly Tupi and Guarani, but also of many other ethnic groups). Interracial breeding have been common and well accepted ever since the first Portuguese settlers arrived. Starting in the late 19th century, Brazil received substantial immigration from several other countries, mainly what are now the countries of Italy, Germany, Spain, Poland, Lebanon and Syria (mostly Christians), Ukraine, Japan, the People's Republic of China and Korea. Jewish people, mainly from Ashkenazi, but also from Sephardi origin, form small but sizeable communities, especially in Rio de Janeiro, São Paulo, and Porto Alegre.
The descendants of European immigrants, particularly the Germans, Italians and Poles, are mainly concentrated in the southern part of the country, in the states of Rio Grande do Sul, Santa Catarina, Paraná, and the most populate, São Paulo; these states have a large majority of people of European descent. In the rest of the country, most of the white population is of older Portuguese settler stock. In the mid-southern states of Rio de Janeiro, Espírito Santo, Minas Gerais, Goiás, Mato Grosso do Sul and in the Federal District, the number of whites is somewhat equal to the number of Afro-Brazilian and mixed race Brazilians.
In the Northeast, which received large masses of African slaves to work in sugarcane, tobacco and cotton plantations, people of African and mixed-race descent predominate, mostly on the coast, whereas in the semi-arid country land (usually called sertão) there's a predominance of white and Amerindian-European mixed people. Most of the black or mulatto people in the sertão are descended from freed African slaves or mulattos who fled away from the coast and worked as cowboys for semi-feudal lords. The city of Salvador da Bahia is considered one of the largest black cities of the world. In the Northwest (covering largely the Brazilian Amazon), a great part of the population has distinguishable ethnic characteristics that emphasize their Amerindian roots. Other ethnic groups have merged with the Indigenous tribes there. This region is not densely populated, and "caboclos", people of mixed native and European descent, are a small part of the entire Brazilian population.
The Japanese are the largest Asian group in Brazil. In fact, Brazil has the largest population of Japanese ancestry outside Japan, with 1.5 million Japanese-Brazilians, most of them living in São Paulo. Some Chinese and Koreans also settled Brazil. Most Chinese came from mainland China, but others came from Taiwan and Hong Kong, and also from Portuguese-speaking Macau—these Chinese from Macau could speak and understand Portuguese, and it was not hard for them to adjust to Brazilian life. Those immigrant populations and their descendants still retain some of their original ethnic identity, however they are not closed communities and are rapidly integrating into mainstream Brazilian society: for instance, very few of the third generation can understand their grandparents' languages.
There are also a large number of Brazilians of Arab descent (around 10%), most of Christian Lebanese or Syrian descent.[14]
Aboriginal Brazilians
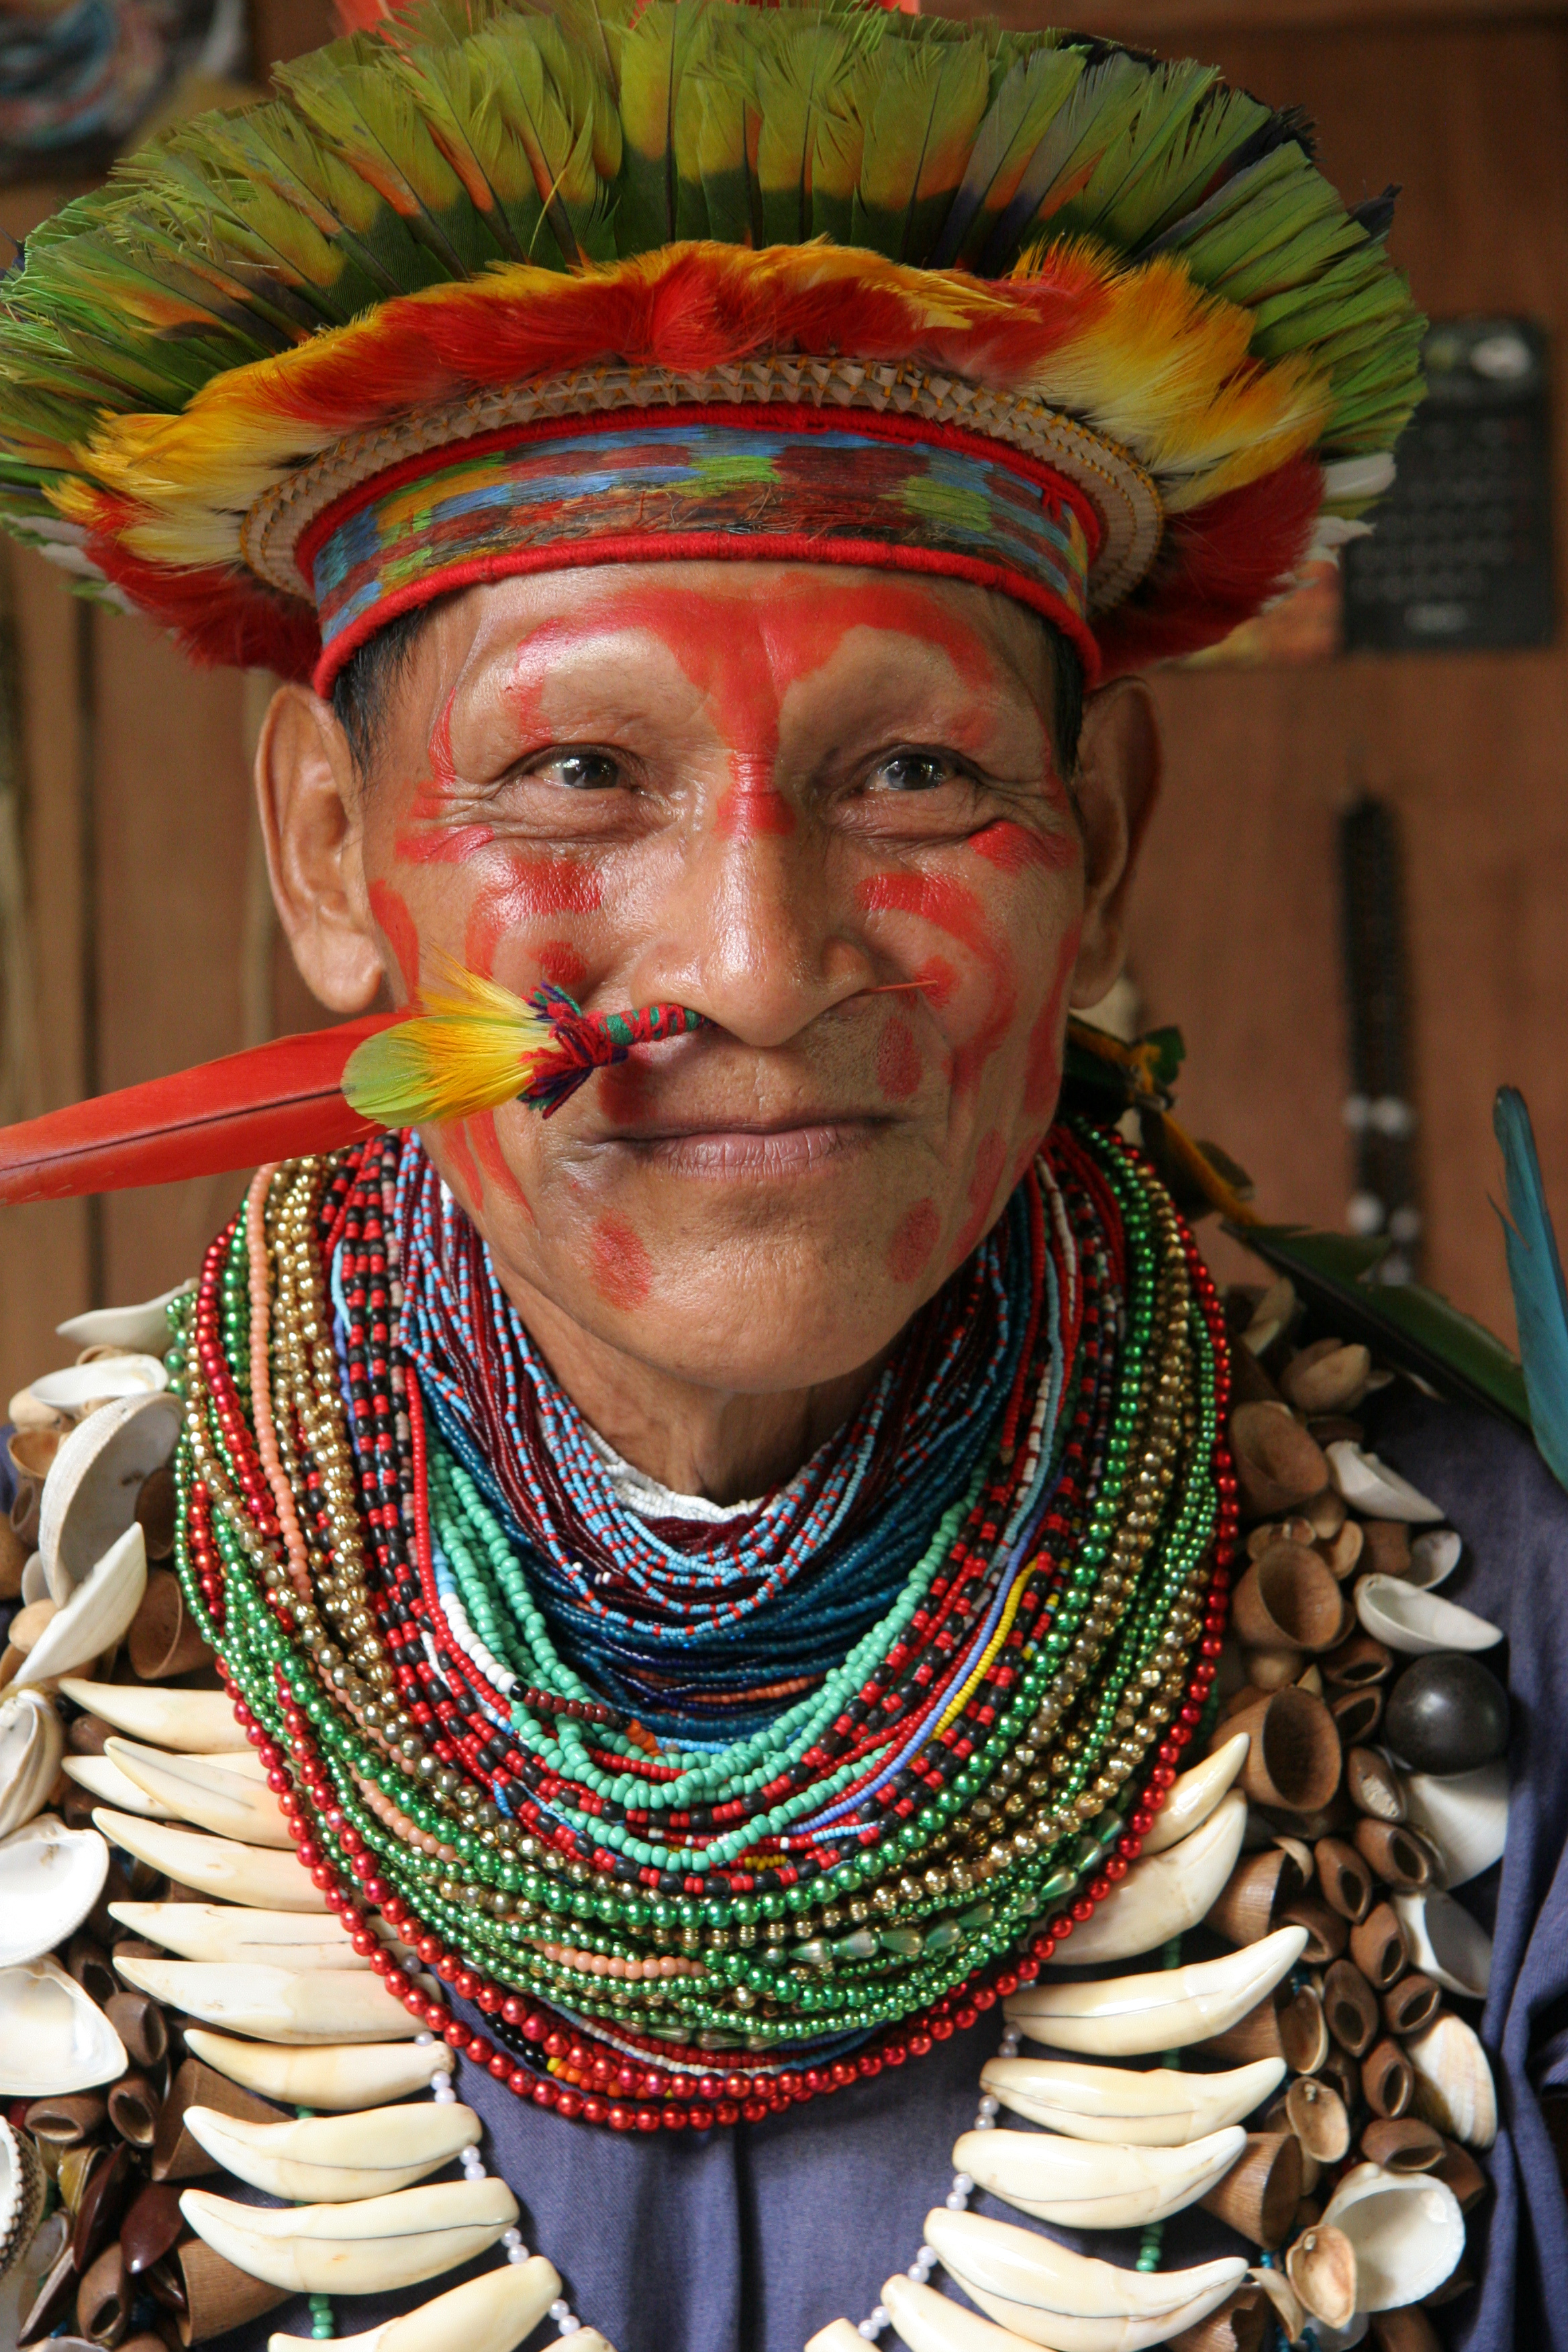
Main article: Indigenous peoples in Brazil A Brazilian Indian from the Chaman tribe.
The Amerindians make up 0.4% of Brazil's population, or about 700,000 people. Indigenous peoples are found in the entire territory of Brazil, although the majority of them live in Indian reservations in the North and Centre-Western part of the country.
Over 60 million Brazilians possess at least one Amerindian ancestor, according to a recent mitochondrial DNA study.[15] However, only 0.4% of the population consider themselves to be Indians. Brazilians tend to consider "Indian" a cultural, not racial category.
When the first Portuguese arrived in Brazil, in 1500, there were about 5 million Indians living in the country. In the mid-19th century they were only 100,000 and in the late 20th century close to 300,000.
Black Brazilians
Main article: Afro-BrazilianAccording to the 2006 census, Blacks number 12.9 million, or 7.4% of Brazil's population.
Slavery in Brazil lasted for 350 years, during which nearly four million Africans were brought to the country. Millions of Brazilians have some African ancestry, though not all of them are reported as black by the IBGE. The number, however, is growing. According to IBGE, this trend is mainly because of the reevaluation of the identity of historically discriminated ethnic groups.[16]
Asian Brazilians
Main article: Asian BrazilianAccording to the 2006 census, people of East Asian descent number 1,919,000, or 1.1% of Brazil's population. Some estimates say that there are at least 2.5 million people of Japanese descent in Brazil, who are mostly concentrated in two states: São Paulo and Paraná, but smaller communities are found in the entire territory of the country. Brazil has the largest population of Japanese descent outside of Japan.[16]
There are also smaller communities of Korean and Chinese origin.
Pardo Brazilians
Main article: Mixed-race BrazilianThe Pardos are a mixture of Europeans, Blacks and Amerindians. Brazil does not have a category for multiracial people, but a Pardo (brown) one, which may include caboclos, mulatos, cafuzos (local ethnonyms for people of noticeable mixed White and Amerindian, Black and White, and Amerindian and Black descent i.e. mestizos, mulattoes and zambos, respectively), the multiracial result of their intermixing (despite most of White and Black Brazilians possessing some degree of race-mixing, since brownness in Brazil is a matter of phenotype) and assimilated, westernized indigenous people.[17][18]
The Pardos make up 42.6% or 79.782 million people of Brazil's population. Multiracial Brazilians live in the entire territory of Brazil. Although, according to DNA resources, most Brazilians possess a mixed-race ancestry, less than 45% of the country's population classified themselves as being part of this group.[19]
White Brazilians
Main article: White BrazilianAccording to the 2009 census, there were more than 107 million White Brazilians, comprising 51.7% of Brazil's population.[16] White Brazilians are defined as people who are solely or mostly descended from European immigrants. Whites are found in the entire territory of Brazil, although they are most concentrated in the south and southeastern parts of the country.

Nearly one million Europeans arrived in Brazil by 1800; most of them colonists from Portugal. An immigration boom occurred in the 19th and 20th centuries, when nearly six million Europeans immigrated to Brazil, most of them Italians, Portuguese, Germans and Spaniards.
Many White Brazilians have some Amerindian and/or African ancestry (similarly found, but with widely differing percentages of admixture are, in White Americans [20] and White Argentines).[21]
Nowadays, White Brazilians come from a very diverse background, which includes:
- The Dutch were among the Europeans settling in Brazil during the 17th century. From 1630 to 1654, the Dutch controlled the northeast coast of Brazil, establishing their colonial capital in Recife. However, they did not settle Brazil in large numbers.
- The first Germans arrived in Brazil in 1824. Most of them established themselves in rural communities across Southern Brazil, such as São Leopoldo, Novo Hamburgo, Blumenau and Pomerode. In states of the south, such as Santa Catarina and Rio Grande do Sul, they may represent as much as 35% of the population.[22]
- Italians started arriving in Brazil in 1875. First they settled in rural communities across Southern Brazil. In the early 20th century, they mostly settled in the coffee plantations in the Southeast. 25 million Brazilians are of Italian origin, the largest number outside of Italy itself, most of them descended from Northern Italians.
- Poles came in significant numbers to Brazil after 1870. Most of them settled in the State of Paraná, working as small farmers.
- Most Brazilians are fully or partly of Portuguese ancestry. Portuguese settlers began arriving in 1500. Immigration increased during the 18th century and reached its peak in the late 19th and early 20th centuries.
- Spaniards came in large numbers to Brazil, starting in the late 19th century. Most of them were attracted to work in the coffee plantations in the state of São Paulo. Today there is an estimated 15 million Brazilians of direct Spanish descent.[23]
- Ukrainians came mostly in the late 19th century. Currently they number approximately 980,000, most of whom live in a compact settlement in south central Paraná (state)[24]
See also: Dutch Brazilian, German Brazilian, Italian Brazilian, Polish Brazilian, Portuguese Brazilian, Spanish immigration to Brazil, and Ukrainian BrazilianComposition of Brazil, genetic studies
Genetic studies have shown the Brazilian population as a whole to have European, African and Native Americans components.
Autosomal studies
A recent autosomal DNA study (2011), with nearly 1000 samples from all over the country ("whites", "pardos" and "blacks"), found out a major European contribution, followed by a high African contribution and an important Native American component.[25] "In all regions studied, the European ancestry was predominant, with proportions ranging from 60.6% in the Northeast to 77.7% in the South".[25] The 2011 autosomal study samples came from blood donors (the lowest classes constitute the great majority of blood donors in Brazil [26]), and also public health institutions personnel and health students. The study showed that Brazilians from different regions are more homogenous than previously thought by some based on the census alone. "Brazilian homogeneity is, therefore, a lot greater between Brazilian regions than within Brazilians region".[27]
Region[25] European African Native American Northern Brazil 68,80% 10,50% 18,50% Northeast of Brazil 60,10% 29,30% 8,90% Southeast Brazil 74,20% 17,30% 7,30% Southern Brazil 79,50% 10,30% 9,40% According to an autosomal DNA study from 2010, "a new portrayal of each ethnicity contribution to the DNA of Brazilians, obtained with samples from the five regions of the country, has indicated that, on average, European ancestors are responsible for nearly 80% of the genetic heritage of the population. The variation between the regions is small, with the possible exception of the South, where the European contribution reaches nearly 90%. The results, published by the scientific magazine American Journal of Human Biology by a team of the Catholic University of Brasília, show that, in Brazil, physical indicators such as skin colour, colour of the eyes and colour of the hair have little to do with the genetic ancestry of each person, which has been shown in previous studies (regardless of census classification).[28] "Ancestry informative SNPs can be useful to estimate individual and population biogeographical ancestry. Brazilian population is characterized by a genetic background of three parental populations (European, African, and Brazilian Native Amerindians) with a wide degree and diverse patterns of admixture. In this work we analyzed the information content of 28 ancestry-informative SNPs into multiplexed panels using three parental population sources (African, Amerindian, and European) to infer the genetic admixture in an urban sample of the five Brazilian geopolitical regions. The SNPs assigned apart the parental populations from each other and thus can be applied for ancestry estimation in a three hybrid admixed population. Data was used to infer genetic ancestry in Brazilians with an admixture model. Pairwise estimates of F(st) among the five Brazilian geopolitical regions suggested little genetic differentiation only between the South and the remaining regions. Estimates of ancestry results are consistent with the heterogeneous genetic profile of Brazilian population, with a major contribution of European ancestry (0.771) followed by African (0.143) and Amerindian contributions (0.085). The described multiplexed SNP panels can be useful tool for bioanthropological studies but it can be mainly valuable to control for spurious results in genetic association studies in admixed populations".[29] It is important to note that "the samples came from free of charge paternity test takers, thus as the researchers made it explicit: "the paternity tests were free of charge, the population samples involved people of variable socioeconomic strata, although likely to be leaning slightly towards the ‘‘pardo’’ group".[30]
Region[30] European African Native American North Region 71,10% 18,20% 10,70% Northeast Region 77,40% 13,60% 8,90% Central-West Region 65,90% 18,70% 11,80% Southeast Region 79,90% 14,10% 6,10% South Region 87,70% 7,70% 5,20% An autosomal DNA study from 2009 found a similar profile "all the Brazilian samples (regions) lie more closely to the European group than to the African populations or to the Mestizos from Mexico".[31]
Region[32] European African Native American North Region 60,6% 21,3% 18,1% Northeast Region 66,7% 23,3% 10,0% Central-West Region 66,3% 21,7% 12,0% Southeast Region 60,7% 32,0% 7,3% South Region 81,5% 9,3% 9,2% According to another autosomal DNA study from 2008, by the University of Brasília (UnB), European ancestry dominates in the whole of Brazil (in all regions), accounting for 65,90% of heritage of the population, followed by the African contribution (24,80%) and the Native American (9,3%).[33]
Races and ethnicities by region
South
The South of Brazil is the region with the largest percentage of Whites. According to the 2005 census, people of European ancestry account for 79.6% of the population.[16] In colonial times, this region had a very small population.
The region what is now Southern Brazil was originally settled by Amerindian peoples, mostly Guarani and Kaingangs.[34] Only a few settlers from São Paulo were living there[when?]. This situation made the region vulnerable to attacks from neighboring countries. This fact forced the King of Portugal to decide to populate the region. For this, settlers from the Portuguese Azores islands were sent to the coast[when?].
To stimulate the immigration to Brazil, the king offered several benefits for the Azorean couples. Between 1748 and 1756, six thousand Portuguese from the Azores moved to the coast of Santa Catarina. They were mainly newly married who were seeking a better life. At that time, the Azores were one of the poorest regions of Portugal. They established themselves mainly in the Santa Catarina Island, nowadays the region of Florianópolis. Later, some couples moved to Rio Grande do Sul, where they established Porto Alegre, the capital. The Azoreans lived on fishing and agriculture, especially flour. They composed over half of Rio Grande do Sul and Santa Catarina's population in the late 18th century.[35] [35] The state of Paraná was settled by colonists from São Paulo due to their proximity (Paraná was part of São Paulo until the mid-19th century).
With the development of cattle in the interior of Rio Grande do Sul, African slaves began arriving in large numbers. By 1822, Blacks were 50% of Rio Grande do Sul's population. This number decreased to 25% in 1858 and to only 5.2% in 2005. Most of them came from Angola.[36]
After independence from Portugal (1822) the Brazilian government started to stimulate the arrival of a new wave of immigrants to settle the South. In 1824 they established São Leopoldo, a German community. Major Schaeffer, a German who was living in Brazil, was sent to Germany in order to bring immigrants. From Rhineland-Palatinate, the Major brought the immigrants and soldiers. Settlers from Germany were brought to work as small farmers, because there were many land holdings without workers. To attract the immigrants, the Brazilian government had promised large tracts of land, where they could settle with their families and colonize the region. The first years were not easy. Many Germans died of tropical disease, while others left the colonies to find better living conditions. The German colony of São Leopoldo was a disaster. Nevertheless, in the following years, a further 4,830 Germans arrived at São Leopoldo, and then the colony started to develop, with the immigrants establishing the town of Novo Hamburgo (New Hamburg). From São Leopoldo and Novo Hamburgo, the German immigrants spread into others areas of Rio Grande do Sul, mainly close to sources of rivers. The whole region of Vale dos Sinos was populated by Germans. During the 1830s and part of the 1840s German immigration to Brazil was interrupted due to conflicts in the country (War of the Farrapos). The immigration restarted after 1845 with the creation of new colonies. The most important ones were Blumenau, in 1850, and Joinville in 1851, both in Santa Catarina state; these attracted thousands of German immigrants to the region. In the next five decades, other 28 thousand Germans were brought to Rio Grande do Sul to work as small farmers in the countryside.[37] Until 1914, it is estimated that 50 thousand Germans settled in this state.
Another immigration boom to this region started in 1875. Communities with Italian immigrants were also created in southern Brazil. The first colonies to be populated by Italians were created in the highlands of Rio Grande do Sul (Serra Gaúcha). These were Garibaldi and Bento Gonçalves. These immigrants were predominantly from Veneto, in northern Italy. After five years, in 1880, the great numbers of Italian immigrants arriving caused the Brazilian government to create another Italian colony, Caxias do Sul. After initially settling in the government-promoted colonies, many of the Italian immigrants spread themselves into other areas of Rio Grande do Sul seeking further opportunities. They created many other Italian colonies on their own, mainly in highlands, because the lowlands were already populated by Germans and native gaúchos. The Italian established many vineyards in the region. Nowadays, the wine produced in these areas of Italian colonization in southern Brazil is much appreciated within the country, though little is available for export. In 1875, the first Italian colonies were established in Santa Catarina, which lies immediately to the north of Rio Grande do Sul. The colonies gave rise to towns such as Criciúma, and later also spread further north, to Paraná.
A significant number of Poles have settled in Southern Brazil. The first immigrants arrived in 1869 and until 1959, it is estimated that over 100,000 Poles migrated to Brazil,[38] 95% of whom were peasants. The State of Paraná received the majority of Polish immigrants, who settled mainly in the region of Curitiba, in the towns of Mallet, Cruz Machado, São Matheus do Sul, Irati, and União da Vitória. Russians and Ukrainians are present as well.
Southeast
The Southeastern region of Brazil is the ethnically most diverse part of the country. Whites make up 58.8% of its population, and those of mixed-race and African descent make up, together, 40.2%. It has the largest percentage of Asian Brazilians, composing 0.8%, and small Amerindian community (0.2%).
Southeast Brazil is home to the oldest Portuguese village in the Americas, São Vicente, São Paulo, established in 1532.[39] The region, since the beginning of its colonization, is a melting pot of Whites, Indians and Blacks. The Amerindians of the region were enslaved by the Portuguese. The race mixing between the Indian females and their White masters produced the Bandeirante, the colonial inhabitant of São Paulo, who formed expeditions that crossed the interior of Brazil and greatly increased the Portuguese colonial territory. The main language spoken by these people of mixed Indian/Portuguese heritage was Língua geral, a language that mixed Tupi and Portuguese words.
In the late 17th century the Bandeirantes found gold in the area that nowadays is Minas Gerais. A gold rush took place in Brazil, and thousands of Portuguese colonists arrived during this period. The confrontation between the Bandeirantes and the Portuguese for obtaining possession of the mines led to the Emboabas' War. The Portuguese won the war. The Amerindian culture declined, giving space to a stronger Portuguese cultural domination. In order to control the richness, the Portuguese Crown moved the capital of Brazil from Salvador, Bahia to Rio de Janeiro. Thousands of African slaves were brought to work in the gold mines. They were landed in Rio de Janeiro and sent to other regions. By the late 18th century, Rio de Janeiro was an "African city": most of its inhabitants were slaves. No other place in the world had so many slaves, since the end of the Roman Empire.[40] In 1808 the Portuguese Royal Family, fleeing from Napoleon, took charge in Rio de Janeiro. Some 15 thousand Portuguese nobles moved to Brazil. The region changed a lot, becoming more European.
After independence and principally after 1850, Southeast Brazil was "inundated" by European immigrants, who were attracted by the government to replace the African slaves in the coffee plantations. Most immigrants landed in the Port of Santos and have been forwarded to the coffee farms within São Paulo. The vast majority of the immigrants came from Italy. Brazil attracted nearly 5 million immigrants between 1870 and 1953. The large amounts of Italians are visible in many parts of Southeast Brazil. Their descendants are nowadays predominant in many areas. Northeast São Paulo is 65% Italian, for example.[41]
The arrival of immigrants from several places of Europe, the Middle-East and Asia produced an ethnically diverse population. The city of Bastos, in São Paulo, is 11.4% Japanese. The city of São Paulo is home to the largest Japanese population outside of Japan itself. [42]
Northeast
The population of Northeast Brazil is a result of an intensive race mixing, which has occurred in the region for more than four centuries. According to the 2006 census people reported as "brown" make up 62.5% of the population. Those reported as Black account for 7.8%.
This region did not have much effect from the massive European immigration that took place in Southern Brazil in the late 19th century and first decades of the 20th century. The Northeast has been a poorer region of Brazil since the decadence of sugar cane plantations in the late 17th century, so its economy did not demand immigrants.
The ethnic composition of the population starts in the 16th century. The Portuguese settlers rarely brought women, which led to relationships with the Indian women. Later, interracial relationships occurred between Portuguese and African females. The coast, in the past a place to the arrival of millions of Black slaves (mostly from modern-day Angola, Nigeria and Benin) to embrace the plantations of sugar-cane, is where nowadays there is a predominance of Mulattoes, those of Black and White ancestry. Salvador, Bahia is considered the largest Black city outside of Africa, with over 80% of its inhabitants being African-Brazilians. In the interior, there is a predominance of Indian and White mixture.[43]
North
Northern Brazil, largely covered by the Amazon rainforest, is the Brazilian region with the largest Amerindian influences, both in culture and ethnicity. Inhabited by diverse indigenous tribes, this part of Brazil was reached by Portuguese and Spanish colonists in the 17th century, but it started to be populated by non-Indians only in the late 19th and early 20th centuries. The exploitation of rubber used in the growing industries of automobiles, has emerged a huge migration to the region. Many people from the poor Northeast Brazil, mostly Ceará, moved to the Amazon area. The contact between the Indians and the northeastern rubbers created the base of the ethnic composition of the region, with its mixed-race majority.
Central-West
The Central-West region of Brazil was inhabited by diverse Indians when the Portuguese arrived in the early 18th century. The Portuguese came to explore the precious stones that were found there. Contact between the Portuguese and the Indians created a mixed-race population. Until the mid-20th century, Central-West Brazil had a very small population. The situation changed with the construction of Brasilia, the new capital of Brazil, in 1960. Many workers were attracted to the region, mostly from northeastern Brazil.
A new wave of settlers started arriving from the 1970s. With the mechanization of agriculture in the South of Brazil, many rural workers of German and Italian origin migrated to Central-West Brazil. In some areas, they are already the majority of the population.
Education and health
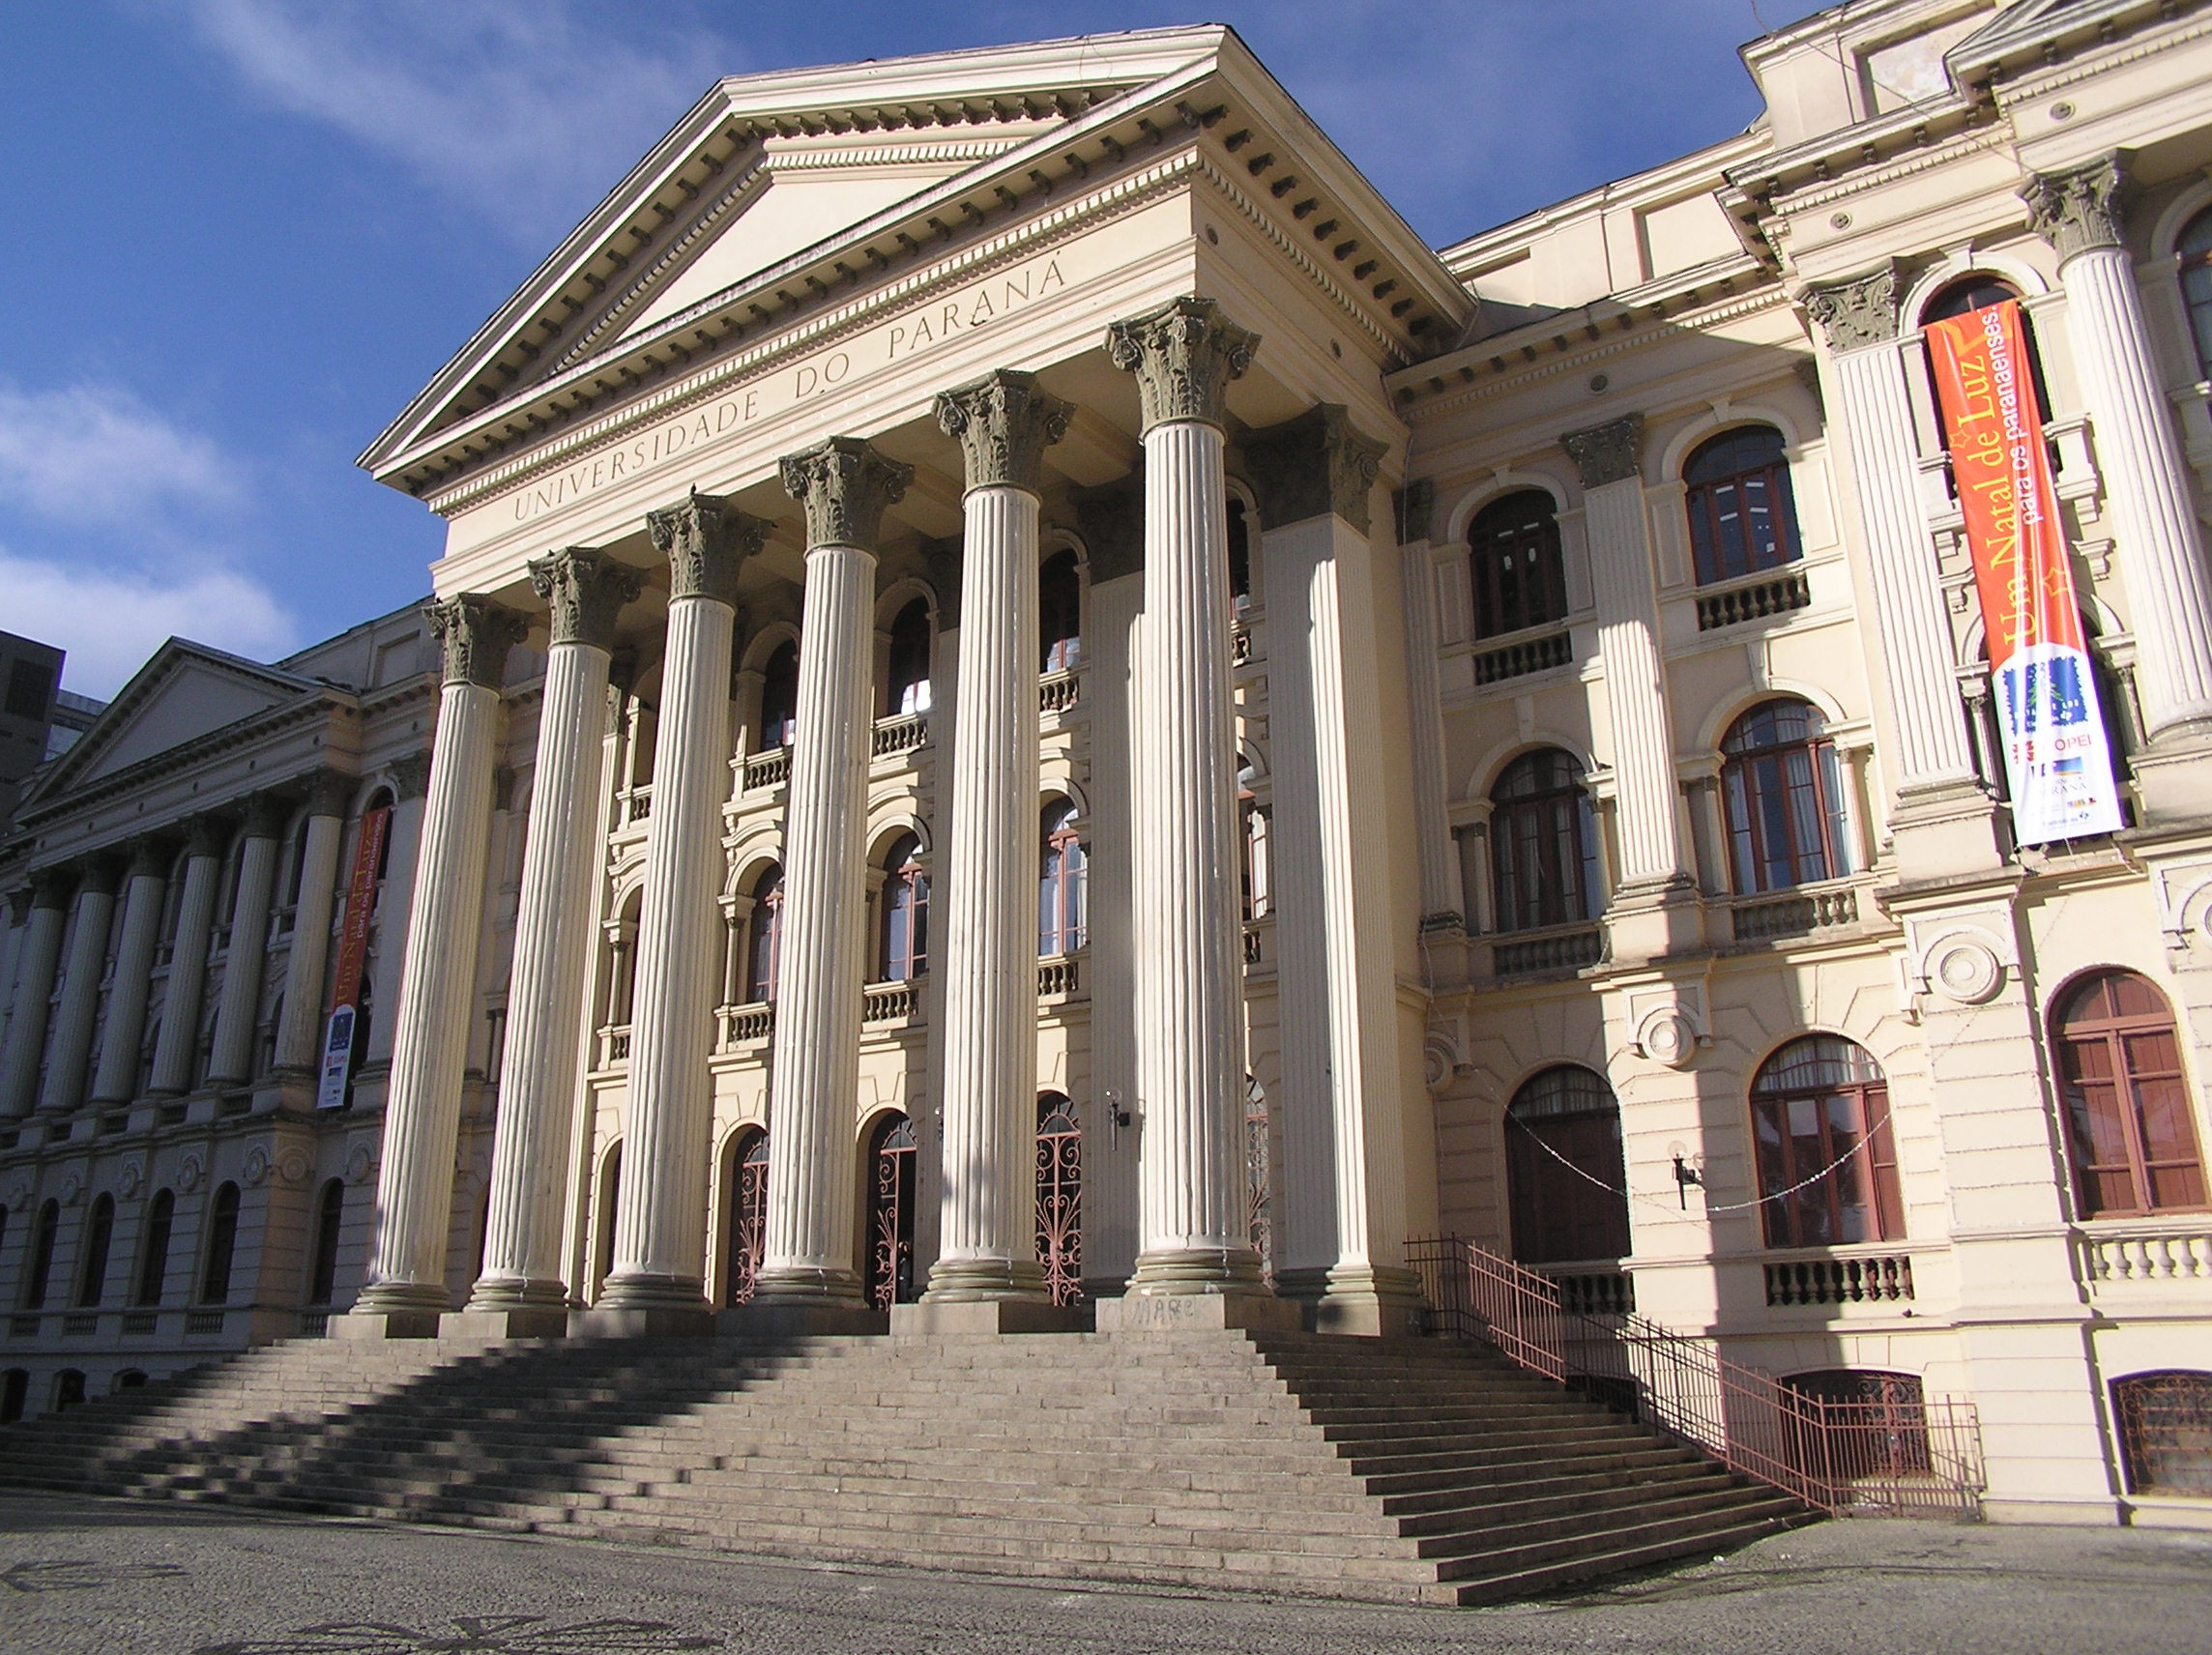
Main articles: Education in Brazil and Health care in Brazil Federal University of Paraná, in Curitiba.
The Federal Constitution of 1988 and the 1996 General Law of Education in Brazil (LDB) attributed to the Federal Government, states, Federal District and municipalities the responsibility of managing the Brazilian educational system, considering three educational public systems as a basis for collaboration between these federal systems. Each of these public educational systems is responsible for its own maintenance, which manages funds as well as mechanisms and sources for financial resources. The new Constitution reserves 25% of state and municipal taxes and 18% of federal taxes for education.[44]
As set out by the Brazilian Constitution, the main responsibility for basic education is attributed to the states and municipalities. Hence, a historical feature of Brazilian basic education is its extremely decentralized nature, which gives great organizational autonomy to sub-national governments (27 states and 5,546 municipalities) in organizing their educational systems. Early childhood education, from 0–6 years, is under exclusive responsibility of the municipalities. Responsibility for compulsory primary education from 1st to 9th grades is shared between states and municipalities. Kindergarten and pre-school education are the responsibility of local levels of government, whereas secondary schools are under the responsibility of the states. Maintenance of the system, including salaries, the definition of teacher career structures and supervision of early childhood, primary, and secondary levels (which make up basic education) is decentralized, and these levels are responsible for defining their respective curriculum content.
Higher education starts with undergraduate or sequential courses, which may offer different specialization choices such as academic or vocational paths. Depending on the choice, students may improve their educational background with Stricto Sensu or Lato Sensu postgraduate courses. Higher education has three main purposes: teaching, research and extension, each with their own specific contribution to make to a particular course. Diplomas and certificates are proof of having passed through higher education.
In 2003, the literacy rate was at 88 percent of the population, and the youth literacy rate (ages 15–19) was 93.2 percent.[44] However, Brazilian analysts tend to approach these favorable numbers with suspicion, considering the generally poor levels of performance displayed by students, especially in the public school network.
According to Brazilian Government, the most serious health problems are:[45]
- Childhood mortality: about 2.51% of childhood mortality, reaching 3.77% in the northeast region.
- Motherhood mortality: about 73.1 deaths per 100,000 born children in 2002.
- Mortality by non-transmissible illness: 151.7 deaths per 100,000 inhabitants caused by heart and circulatory diseases, along with 72.7 deaths per 100,000 inhabitants caused by cancer.
- Mortality caused by external causes (transportation, violence and suicide): 71.7 deaths per 100,000 inhabitants (14.9% of all deaths in the country), reaching 82.3 deaths in the southeast region.
Religion
Main article: Religion in Brazil Pope Benedict XVI in his official visit to Brazil, in May, 2007.
According to the IBGE census: 74% are Roman Catholics (about 130 million); 15.4% are Protestants (about 28 million); 7.4% consider themselves agnostics, atheists or without a religion (about 12 million); 1.3% are followers of Spiritism (about 2.2 million); 0.3% are followers of African traditional religions such as Candomblé and Umbanda; 1.7% are members of other religions. Some of these are Jehovah's Witnesses (1,100,000), Latter-day Saints (200,000), Buddhism (215,000), Judaism (86,000), and Islam (27,000)[46] and some practice a mixture of different religions, such as Catholicism, Candomblé, and indigenous American religions[citation needed].
Brazil has the largest Roman Catholic population in the world.
Followers of Protestantism are rising in number. Until 1970, the majority of Brazilian Protestants were adherents of "traditional churches", mostly Lutherans, Presbyterians and Baptists. Since then, numbers of Pentecostal and Neopentecostal adherents have increased significantly.
Islam in Brazil was first practiced by African slaves.[47] Today, the Muslim population in Brazil is made up mostly of Arab immigrants. The US Department of State claims there is a recent trend of increased conversions to Islam among non-Arab citizens.[48]
The largest population of Buddhists in Latin America lives in Brazil. This is mostly because Brazil has the largest Japanese population outside Japan.[49]
About 8% of Brazilians declared themselves to be non-religious (with 2% declaring themselves atheists) and 58% of Catholics considered themselves "not very practicing" or "not at all practicing".[50][citation needed]
According to IBGE 2000 Census,[51] the following are the largest religious denominations in Brazil, with those with more than a half million members only shown.
Rank Group Members Other information 1 Roman Catholic Church 135 million -
- Its Charismatic Renewal branch is fast growing; the Progressive Branch (Liberation Theology) and the Conservative branch are in decline. Only 30% of the Roman Catholic Church's membership attends the church regularly.
- The Personal Apostolic Administration of Saint John Mary Vianney in Campos dos Goytacazes is one of the most leading traditionalist Catholic groups in the world.
- See Roman Catholicism in Brazil.
2 Non-religious 12.5 million -
- including, but not limited to, Atheists and Agnostics
3 Assemblies of God
(Assembléias de Deus)8.4 million -
- General Convention of the Assemblies of God (Affiliated with the American Assemblies of God, Springfield, MO): 3,6 Million.
- National Convention of the Assemblies of God: 2,5 Million. A.k.a. Madureira Ministry of the Assemblies of God.
- Other independent Assemblies of God: 2,3 Million, such as Bethesda Assemblies of God.
4 Baptist 3.1 million -
- Brazilian Baptist Convention: 1,2 Million adherents. Affiliated to US Southern Baptists.
- National Baptist Convention: 1 Million. Pentecostal Baptists.
- Independent Baptist Convention: 400,000. Scandinavian Baptists.
- Other Baptists: 400,000.
5 Christian Congregation of Brazil 2.4 million 6 Spiritist 2.2 million -
- Kardec Spiritualist; does not include Afro-Brazilian Sincretists. Their influence is much larger than their numbers.
7 Universal Church of the Kingdom of God
(Igreja Universal do Reino de Deus)2.1 million -
- Neo-Pentecostal Movement.
8 Foursquare Gospel Church 1.3 million -
- Classic Pentocostals in US, but second-wave pentecostals in Brazil.
9 Adventists 1.2 million -
- Seventh-day Adventist Church: 900,000.
- Promise Adventist Church: 150,000. Indigenous Pentecostal Adventists.
- Seventh Day Adventist Reform Movement: 50,000.
- Other Adventists: 100,000.
10 Jehovah's Witnesses 1.1 million 11 The Church of Jesus Christ of Latter-day Saints 1 million 12 Lutherans 1 million -
- Evangelical Church of Lutheran Confission.
- Evangelical Lutheran Church of Brazil.
- Other Lutherans.
13 Calvinists 981,000 -
- Presbyterian Church of Brazil: 500,000.
- Independent Presbyterian Church: 250,00.
- Congregationalists: 150,000.
- Other Calvinists:100,000.
14 God is Love Pentecostal Church 774,000 -
- Divine Healing movement.
15 Afro-Brazilian 525,000 - Umbanda (397,000) and Candomblé (128,000)
16 Brazilian Catholics 500,000 - Others and no religion declared 3.5 million Languages
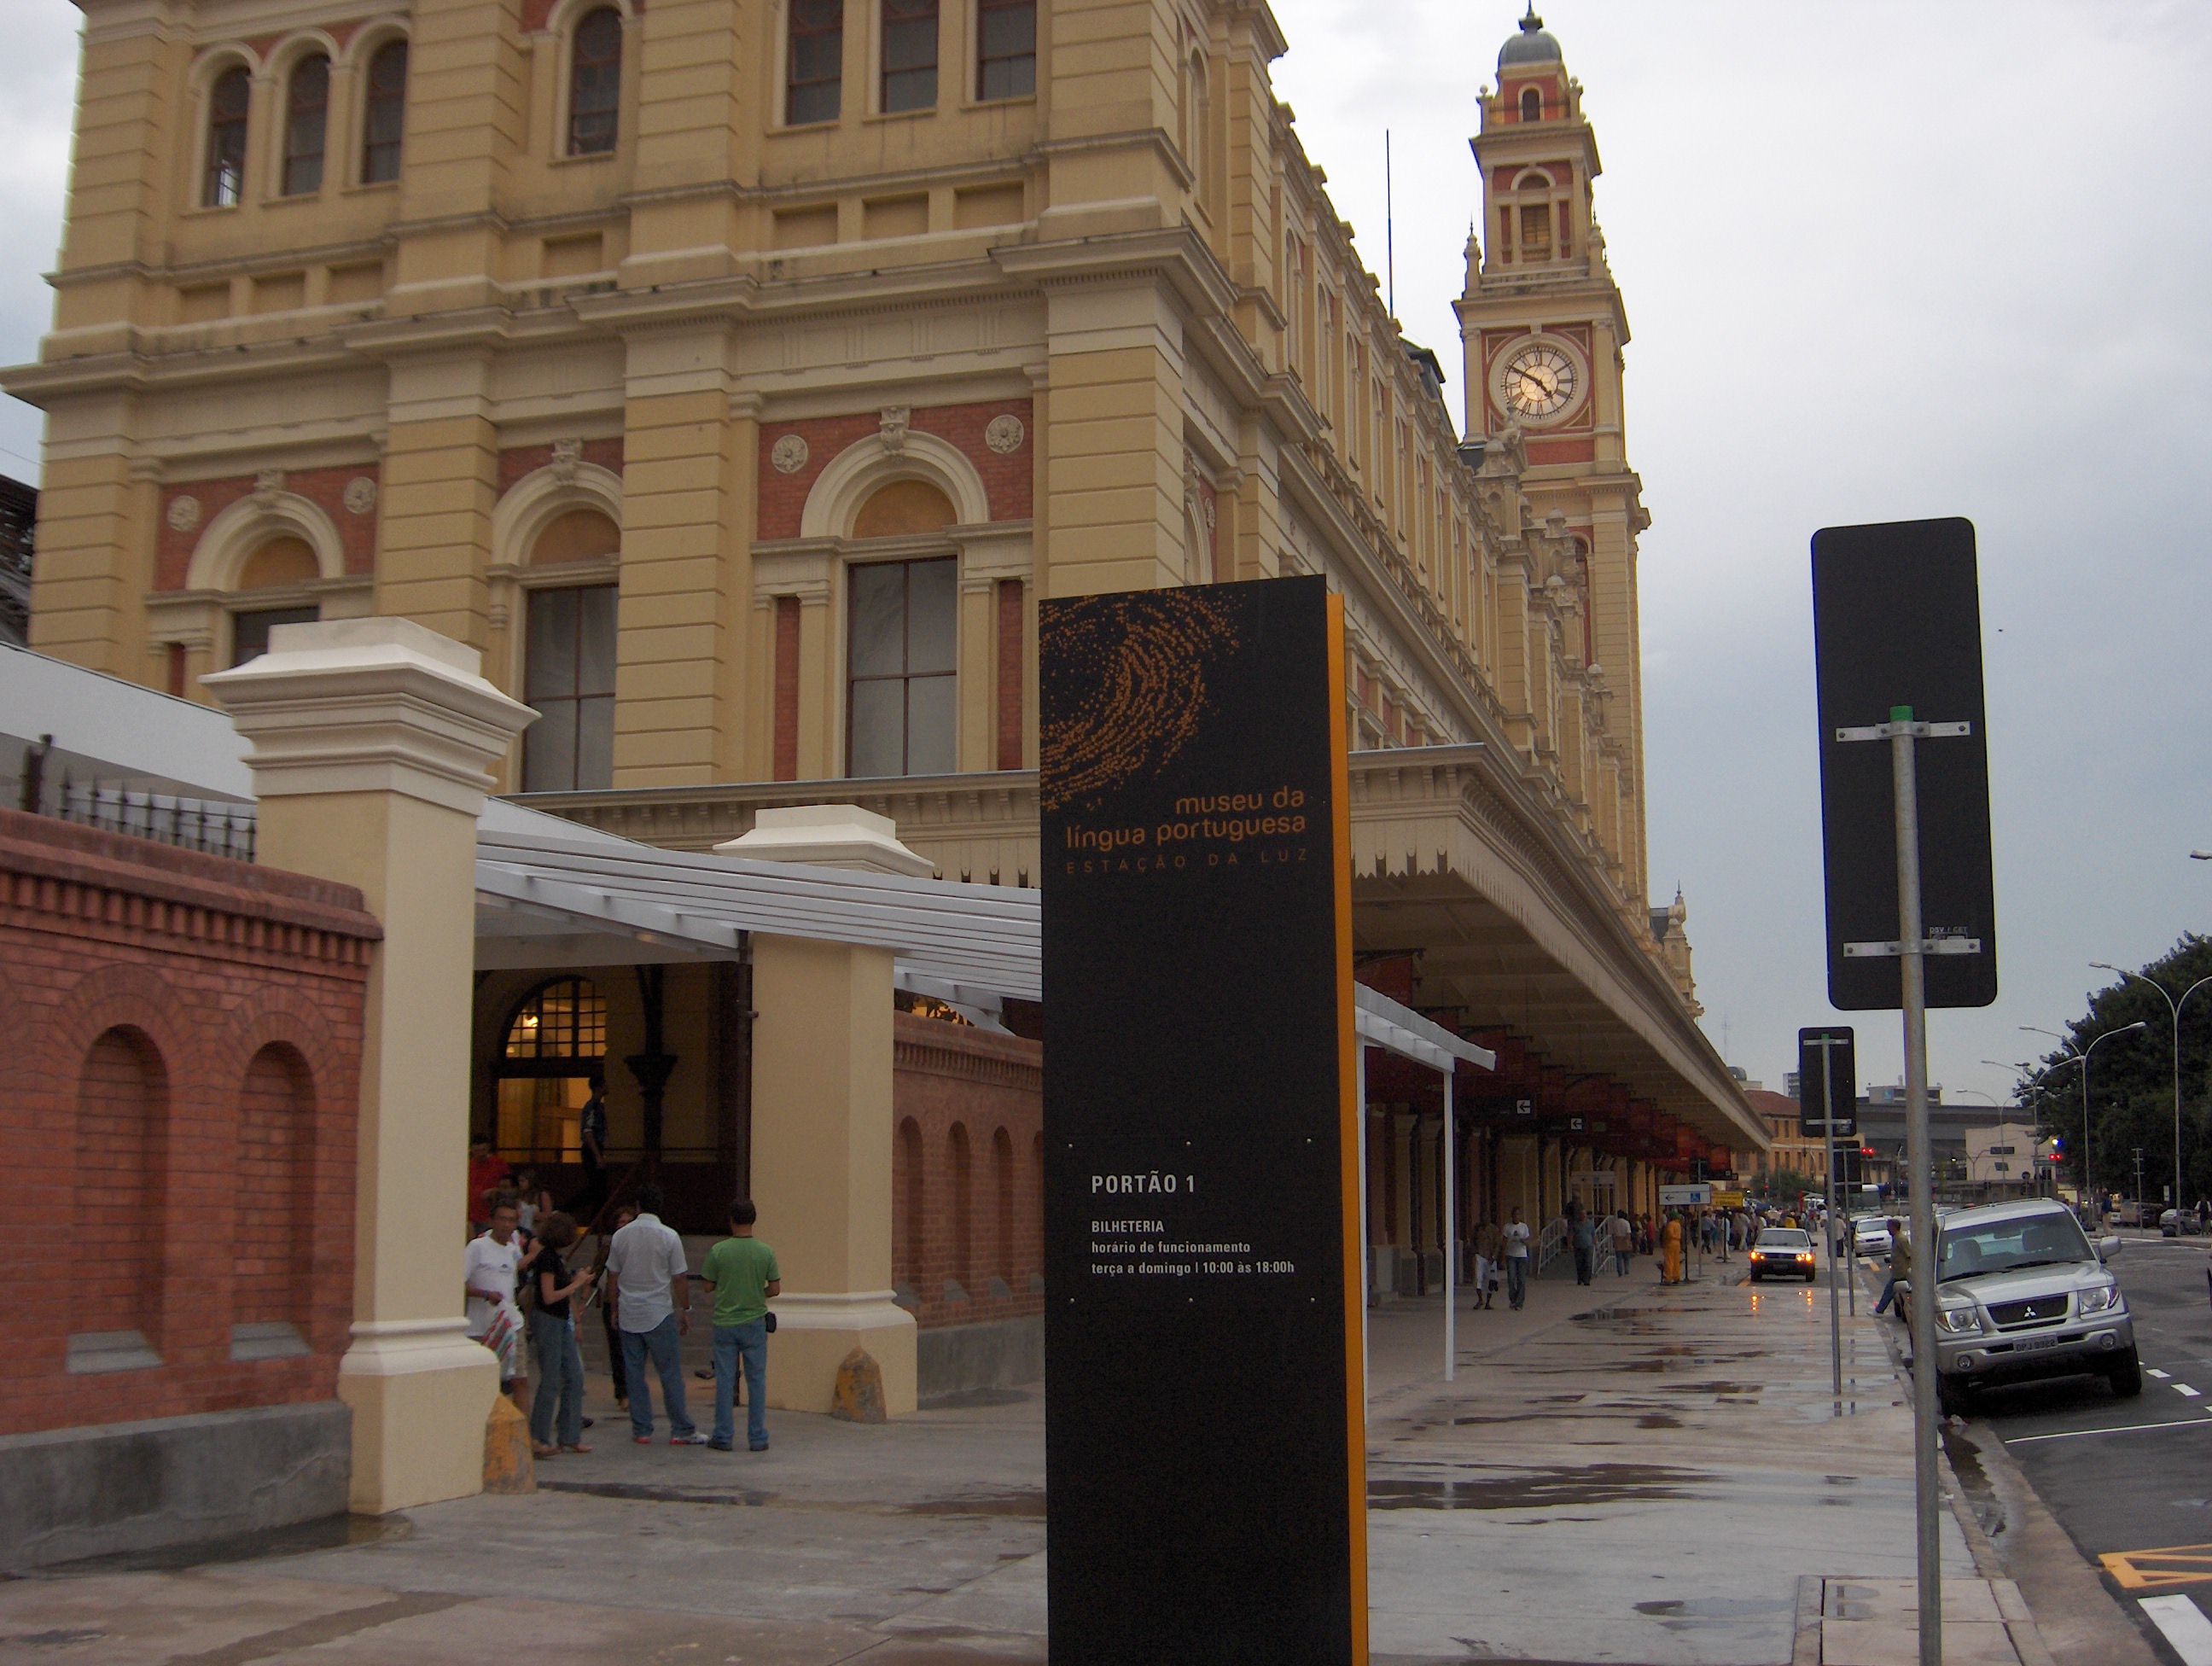
Main articles: Languages of Brazil and Brazilian PortuguesePortuguese is the only official language of Brazil.[52] It is spoken by nearly the entire population and is virtually the only language used in schools, newspapers, radio, TV and for all business and administrative purposes. Moreover, Brazil is the only Portuguese-speaking nation in the Americas, making the language an important part of Brazilian national identity.
Many Amerindian languages are spoken daily in indigenous communities, primarily in Northern Brazil. Although many of these communities have significant contact with Portuguese,[53] today there are incentives stimulating preservation and the teaching of native languages. According to SIL International, 133 native American languages are currently endangered. Some of the largest indigenous language groups include Arawak, Carib, Macro-Gê and Tupi.[54] In 2006, the City of São Gabriel da Cachoeira in the region of Cabeça do Cachorro (Northwestern region of the State of Amazonas), has adopted some indigenous languages as some of its other official languages along with Portuguese.
Other languages are spoken by descendants of immigrants, who are usually bilingual, in small rural communities in Southern Brazil. The most important are the Brazilian German dialects, such as Riograndenser Hunsrückisch and the Pomeranian language, and also the Talian, based on the Italian Venetian language. In the city of São Paulo, Levantine Arabic, Japanese, Chinese and Korean can be heard in the immigrant neighborhoods, such as Liberdade.
English is also part of the official high school curriculum in most of the Brazilian states, but very few Brazilians are fluent. Spanish is understood to varying degrees by many Brazilians, especially on the borders with Argentina, Paraguay and Uruguay.
Demographic Breakdown
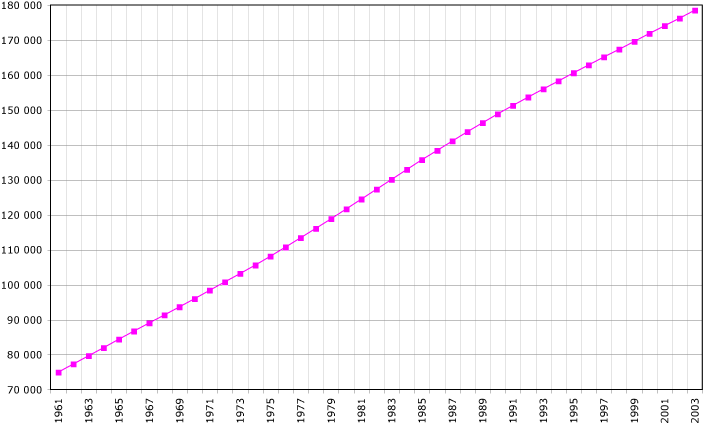
 Demographics of Brazil, Data of FAO, year 2005 ; Number of inhabitants in thousands.
Population
According to the 2008 PNAD (National Household Sample Survey), conducted by the IBGE, the Brazilian Statistics bureau, there were about 189,953,000 inhabitants in 2008.[55] As of the latest (2010) census, the Brazlian government estimates its population at 190.8 mn.
The population of Brazil is estimated based on various sources from 1550 to 1850. The first official census took place in 1872. From this year, every 10 years (with some exceptions) the population is counted.
Brazil is the fifth most populated country in the world.
 Population of Brazil, 1550–2005
- 1550 - 15,000
- 1600 - 100,000
- 1660 - 184,000
- 1700 - 300,000
- 1766 - 1,500.000
- 1800 - 3,250.000
- 1820 - 4,717,000
- 1850 - 7,256,000
- 1872 - 9,930,478
- 1890 - 14,333,915
- 1900 - 17,438,434
- 1920 - 30,635,605
- 1940 - 41,236,315
- 1950 - 51,944,397
- 1960 - 70,119,071
- 1970 - 93,139.037
- 1980 - 119,070,865
- 1991 - 146,917,459
- 1996 - 157,079,573
- 2000 - 169,544,443
- 2005 - 183,886,761[56][citation needed]
- 2010 - 190,755,799 [Source: Government of Brazil]
Population distribution in Brazil is very uneven. The majority of Brazilians live within 300 kilometers of the coast, while the interior in the Amazon Basin is almost empty. Therefore, the densely populated areas are on the coast and the sparsely populated areas are in the interior. This historical pattern is little changed by recent movements into the interior.
CIA World Factbook demographic statistics
The following demographic statistics are from the CIA World Factbook, unless otherwise indicated.
Age structure
- 0-14 years: 26.7% (male 27,092,880/female 26,062,244)
- 15-64 years: 66.8% (male 65,804,108/female 67,047,725)
- 65 years and over: 6.4% (male 5,374,230/female 7,358,082) (2009 est.)
Population growth rate
- 0.98% (CIA 2008 estimate)[57]
Birth rate
- 16.04 births/1,000 population (CIA 2008 est.) [57]
Death rate
- 6.22 deaths/1,000 population (CIA 2008 est.) [57]
Net migration rate
- -0.09 migrant(s)/1,000 population (CIA 2009 estimate)
Sex ratio
- At birth: 1.05 male(s)/female
- Under 15 years: 1.04 male(s)/female
- 15-64 years: 0.983 male(s)/female
- 65 years and over: 0.697 male(s)/female
- Total population: 0.976 male(s)/female (2007 est.)
Infant mortality rate
- Total: 19.67 deaths/1,000 live births
- Male: 26.28 deaths/1,000 live births
- Female: 17.89 deaths/1,000 live births (2010 est.)
Note: states from the south have this rate as low as 12.4 deaths/1,000 live births, which shows an incredible difference concerning quality of life in the various regions of the country.
Life expectancy at birth
total population: 72.24 years
- Male: 68.8 years
- Female: 76.38 years (2008 est.)
Total fertility rate
- 2.19 children born/woman (2010 est.)
Nationality
- Noun: Brazilian(s)
- Adjective: Brazilian
Ethnic groups
The minority ethnic groups in Brazil are various non-assimilated indigenous tribes, comprising less than 1% of the population, who live in officially delimited reservations and either avoid contact with other peoples, or constitute separate social and political communities.
The rest of the population can be considered a single "Brazilian" ethnic group, with highly varied racial types and backgrounds, but without clear ethnic sub-divisions. By "skin colour", or "race", the 2008 PNAD gives 48.43% White, 43.80% Multirracial, 6.84% Black, 0.58% Asian, 0.28% Amerindian, 0.07% undeclared.[58]
The main ethnic origins of Brazilians are: Bantu, Ewe, German, Guarani, Italian, Japanese, Lebanese, Polish, Portuguese, Spanish, Syrian, Tupi, Ukrainian, and Yoruba.
Literacy
Definition: age 15 and over can read and write
- total population: 91.6%
- male: 90.4%
- female: 91.8% (2010 est.)
See also
- Brazil
- Demographics of Rio de Janeiro
- Ethnic groups in Brazil
- Race in Brazil
- Racial democracy
- Brazilian Journal of Population Studies
References
- ^ https://international.ipums.org/international/enum_materials.shtml
- ^ "2010 Brazilian Institute of Geography and Statistics estimate". Brazilian Institute of Geography and Statistics. 29 November 2011. http://www.ibge.gov.br/home/estatistica/populacao/censo2010/primeiros_resultados/populacao_por_municipio_zip.shtm. Retrieved 22 January 2011.
- ^ Sapo.pt Imigrantes
- ^ Country Studies Brazil
- ^ "Entrada de imigrantes no Brasil - 1870/1907" (in Portuguese). Archived from the original on 2007-06-13. http://web.archive.org/web/20070613005222/http://www.memorialdoimigrante.sp.gov.br/historico/e1.htm. Retrieved 2007-06-20.
- ^ "Entrada de imigrantes no Brasil - 1908/1953" (in Portuguese). Archived from the original on 2007-06-13. http://web.archive.org/web/20070613005258/http://www.memorialdoimigrante.sp.gov.br/historico/e2.htm. Retrieved 2007-06-20.
- ^ http://www.schwartzman.org.br/simon/pdf/origem.pdf p.3
- ^ /www.schwartzman.org.br/simon/pdf/origem.pdf Note 3, p.3
- ^ /www.schwartzman.org.br/simon/pdf/origem.pdf Table 6, p.10
- ^ Fora de foco: diversidade e identidade étnicas no Brasil
- ^ FT.com, "Signs betray ‘hidden workers’ of Japan", retrieved 20 July 2007.
- ^ a b Amaral, Ernesto F. (2005) "Shaping Brazil: The Role of International Migration", Migration Policy Institute website. Retrieved 13 June 2007.
- ^ "Jewish Roots of Brazil", Anita Novinsky, 1987
- ^ www.schwartzman.org.br/simon/pdf/origem.pdf Table 6, p.10
- ^ The Ancestry of Brazilian mtDNA Lineages
- ^ a b c d "PNDA Census 2005 race" (in Portuguese) (PDF). http://www.ibge.gov.br/home/estatistica/populacao/condicaodevida/indicadoresminimos/sinteseindicsociais2006/indic_sociais2006.pdf. Retrieved 2007-06-26.
- ^ Edward Eric Telles (2004). "Racial Classification". Race in Another America: the significance of skin color in Brazil. Princeton University Press. pp. 81–84. ISBN 0691118663.
- ^ David I. Kertzer and Dominique Arel (2002). Census and Identity: The Politics of Race, Ethnicity, and Language in National Censuses. Cambridge University Press. pp. 63–64. ISBN 0521004276.
- ^ Estudos Avançados - Pode a genética definir quem deve se beneficiar das cotas universitárias e demais ações afirmativas?
- ^ Racial Reality - White Americans
- ^ El 56% de los argentinos tiene antepasados indígenas
- ^ http://pt.wikipedia.org/wiki/Santa_Catarina
- ^ http://www.mae.es/es/MenuPpal/Paises/ArbolPaises/Brasil/Nota+pais/
- ^ Pacific Island Travel web-site, accessed 4.8.08, taken from: Brazil: the Rough Guide, by David Cleary, Dilwyn Jenkins, Oliver Marshall, Jim Hine. ISBN 1858282233
- ^ a b c http://www4.ensp.fiocruz.br/informe/anexos/ric.pdf
- ^ http://www.amigodoador.com.br/estatisticas.html Profile of the Brazilian blood donor
- ^ http://cienciahoje.uol.com.br/noticias/2011/02/nossa-heranca-europeia/?searchterm=Pena
- ^ DNA de brasileiro é 80% europeu, indica estudo
- ^ http://www.ncbi.nlm.nih.gov/pubmed/19639555 Genetic composition of Brazilian population samples based on a set of twenty-eight ancestry informative SNPs
- ^ a b http://onlinelibrary.wiley.com/doi/10.1002/ajhb.20976/pdf
- ^ http://www.alvaro.com.br/pdf/trabalhoCientifico/ARTIGO_BRASIL_LILIAN.pdf
- ^ Forensic Science International: Genetics. Allele frequencies of 15 STRs in a representative sample of the Brazilian population (inglés) basandos en estudios del IBGE de 2008. Se presentaron muestras de 12.886 individuos de distintas etnias, por regiones, provenían en un 8,26% del Norte, 23,86% del Nordeste, 4,79% del Centro-Oeste, 10,32% del Sudeste y 52,77% del Sur.
- ^ http://bdtd.bce.unb.br/tedesimplificado/tde_busca/arquivo.php?codArquivo=3873
- ^ Página do Gaúcho - Índios - Os grupos indígenas e sua distribuição
- ^ a b Imigrantes: Açorianos
- ^ RS VIRTUAL - O Rio Grande do Sul na Internet - História - Colonização - Negros - A história dos gaúchos sem história
- ^ Germans
- ^ Uma história oculta: a imigração dos países da Europa do Centro-Leste para o Brasil [1]
- ^ RankBrasil - Livro Dos Recordes Brasileiros - Os melhores e maiores do Brasil
- ^ Pdt - Rj
- ^ Fundação Lorenzato
- ^ São Paulo é tudo de bom - Turismo, eventos e entretenimento na cidade de São Paulo
- ^ Regiões do Brasil
- ^ a b Japan Bank for International Cooperation report, November 2005, "Sector Study for Education in Brazil", retrieved 28 February 2007
- ^ Ministério do Planejamento website, "Saúde" (fact sheet, 2002), retrieved 12 June 2007.
- ^ "Religion in Brazil" (pdf). IBGE. 2000. http://www.ibge.gov.br/home/estatistica/populacao/censo2000/populacao/religiao_Censo2000.pdf. Retrieved 2007-04-24.
- ^ Lovejoy, Paul E., Muslim Encounters With Slavery in Brazil, Markus Wiener Pub., 2007. ISBN 1558763783.
- ^ US Department of State, "International Religious Freedom Report 2006", retrieved 5 June 2007
- ^ "MOFA: Japan-Brazil Relations". January 2007. http://www.mofa.go.jp/region/latin/brazil/index.html. Retrieved 2007-06-18. "Population of Japanese descent: 1.3 million (estimated)"
- ^ "Pesquisa de Opinião dos Católicos Brasileiros sobre Direitos Reprodutivos, Relação Igreja-Estado e temas Relacionados" (pdf). http://www.ibope.com.br/opiniao_publica/downloads/opp008_catolicos_brasileiros_nucleo1.pdf. Retrieved 2007-02-19.[dead link]
- ^ (Portuguese) IBGE 2000 Census
- ^ "Portuguese, the official language of Brazil". Brazilan Government official website. http://www.brasil.gov.br/ingles/about_brazil/portuguese_language/. Retrieved 2007-08-04.[dead link]
- ^ "Portuguese throughout the world". Brazilan Government official website. http://www.brasil.gov.br/ingles/about_brazil/portuguese_language/. Retrieved 2007-08-04.[dead link]
- ^ SIL International, "Línguas Indígenas do Brasil", retrieved 12 June 2007.
- ^ IBGE. 2008 PNAD
- ^ tripatlas
- ^ a b c d CIA stats
- ^ IBGE. PNAD 2008. Tabela 262 - População residente, por cor ou raça, situação e sexo
}}
 This article incorporates public domain material from the CIA World Factbook document "2006 edition".
 Brazil
History First inhabitants · Colonization · Empire · Old Republic · Vargas Era · Second Republic · Military rule · ContemporaryGeography Regions · States · Mesoregions · Microregions · Municipalities · Islands · Coastline · Climate · Environment · Extreme points · Protected areas · CapitalsGovernment Constitution · Federal government · President · National Congress · Foreign relations · Law · Law enforcement · MilitaryPolitics Economy Society Demographics · People · Languages · Religion · Immigration · Education · Health · Crime · Social issues · Largest cities · ApartheidCulture Demographics of Brazil Economic and social Apartheid · Attractions · Law · Crime · Education · GDP · Health · Human Development · Human Rights (LGBT Rights) · Immigration · Languages · People · Politics · Poverty · Races · Religions · Traditions · Wealth
Ethnic groups BrazilAfricaAmericasNorth AmericaCaribbeanHaitianSouth AmericaBy EthnicityBy Country
or RegionEasternSouthernEast IndianWesternEuropeBy EthnicityBy Country
or RegionNorthernWesternCentralSouthernBalkanEasternDemographics of South America Sovereign states Dependencies and
other territories- Aruba
- Bonaire
- Curaçao
- Falkland Islands
- French Guiana
- South Georgia and the South Sandwich Islands


Wikimedia Foundation. 2010.